Introduction
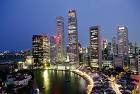
Singapore is characterized by voluminous economic activities as the port of Singapore is a busy and rich port in the world. Figure 1 shows the city of Singapore.
Singapore is an island country located 137 km north of the equator. Singapore is the fourth leading financial center in the world. Singapore port is a busy port in the world. Singapore is one of the highly developed free markets with minimal government intervention. Singapore enjoys an open business environment, stability of prices and transparency. Singapore amongst other countries has high levels of per capita income the economy depends mainly on the export of electronics for consumers, IT products and pharmaceuticals. The national product of Singapore currently is at 243.2 billion United sates dollars for the year 2009 and is believed to rise by a margin of 13%-15% in the year 2010. The United States is the biggest economy in the world has a gross domestic product (GDP) of 14.266 trillion which is much higher compared to that of Singapore.
Growth rate
Singapore emerged as the fastest growing economy after a contraction of up to -6.8% in the 1st half of the year it has exhibited a 17.9% growth rate. Meanwhile, the US growth rate is smaller than that of Singapore although it enjoys the stability of its gross domestic product. According to MIT, the growth in Singapore is supported by a variety range of industries ranging from production and provision of essential services. Rebound will occur cynically in business investment should continue to occur, supported by supportive monetary policies. Demand will continue to increase; the strength of recovery could be made difficult by unemployment and weak household budgets.
Singapore’s economy expanded by 24.0% in the second quarter of the year 2010, moderating from a record growth rate of 45.7% in the first quarter of the year. In the second quarter, gross domestic growth was largest in the manufacturing sector, followed by biomedical and electronics output. The service sector exhibited growth, with tourism industries performing better.
GDP growth in the US slowed to 1.6% in2nd quarter in 2010, from 3.7% in thef1st quarter. The Continued expansion in personal consumption expenditure (2.0%), the increasing gross private domestic investment including stock accumulation (25%), contributed much to the growth, the only setback was increased imports compared to the low volume of exports which reduced the overall gross domestic product by 3.4% points (Ying Yong &Jude, 2009).
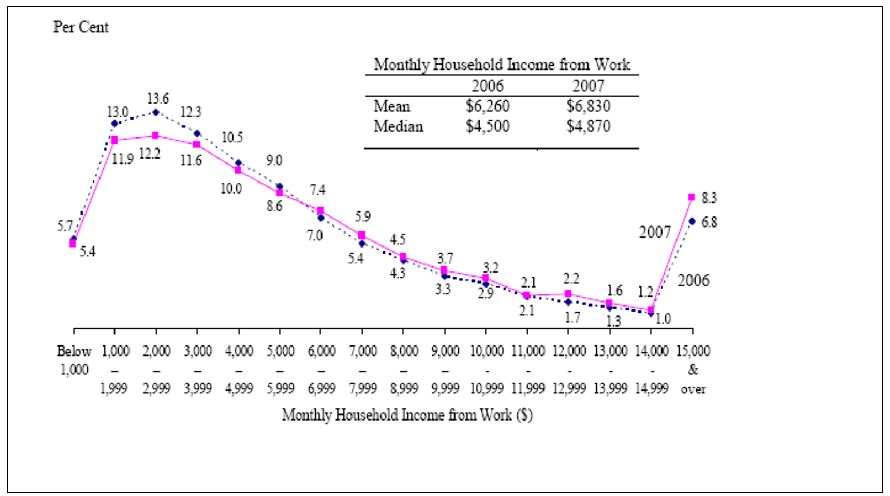
The family income of Singapore is SGD 6830 as provided for the year 2009. The family distribution of income is in the US lower than that of Singapore. Singapore presents a unique case where the income distribution is skewed where the scenario is that more than half the citizens earn only two-thirds of the average wages. The acuteness of the skew is shown in the household income distribution. The graph (figure 3) below shows the skewing of household income in Singapore
Distribution of wealth in Singapore’s economy
Singapore is a rich country associated with the significant rich port holding significant wealth in the world. The setback is that the uneven distribution of wealth is characterized by the disparity of income i.e. few persons carry the highest percentage of wealth; some people hold relatively low amounts of wealth. Wealth in the US is well distributed than in Singapore as most citizens hold the wealth of the country unlike in Singapore. In Singapore, the social classes are distinct as the poor and the rich while in the US they are middle wage-earning persons and therefore it is not easy to distinguish classes of people.
The currency used by Singapore citizens is the Singapore dollar while the United States use is the strong us dollar. The Singapore currency has been appreciating against the US dollar since 1981. Figure 3 shows the Singapore dollar.
The exchange rate of one Singapore dollar against the United States dollar is 0.77155 thus one Singapore dollar is equal to one dollar. To smooth the short-run changes in the exchange rate the Singapore central bank is known as the MAS intervene in the money market when the need arises. MAS tries to line the exchange rate with the fundamentals, and rather not to the contrary. Reviews have shown that the intervention of MAS in stabilizing the exchange rate has been successful as it tries to contract liquidity which strengthens the exchange rates.
The Singapore dollar is stable compared to other currencies. The Singapore dollar remained relatively strong even in the depression compared to the US dollar which depreciated with greater margins.
Cost of common items in comparison of similar products in the US (Weng, 2009)
Table 1. Shows the costs of commodities (Rajan & Thangavule, 2009).
It is important to note that the cost of living is higher in Singapore as most of the goods consumed are imported.
Inflation in Singapore mainly occurs as a result of the increasing cost of products thus the most contributory factor is the CPI, this year the cost-pull inflation rose to 1% in February compared to 0.2% in January. Transport and private costs were the largest contributors to the increase in CPI inflation experienced in February while increases in the prices of food and other costs were modest. During the fiscal of 2010, the cost pull inflation is estimated to be between 2.5% to 3.5%. Inflation of the fiscal year 2010 will occur from the imported inflation this is from high costs of imported goods in the global markets. The internal sources of inflation will lower in the first half of the year but are likely to rise after (Holmes & Venkat).
Reference list
Holmes, S., & Venkat, P.R. (2010). Singapore’s economic outlook improves. The Wall Street Journal, 13. Web.
Rajan, R. S., & Thangavule, S. (2009). Singapore: Trade, investment and economic performance. Singapore: World Scientific Publishing Inch.
Weng, H. K. (2009). Growth accountability for a technology follower in a world of ideas: The case of Singapore. Journal of Asian economic, 20(2), 156-173.
Yin-wong, C., & Jude, Y. (2002). Effects of US inflation on Hong Kong and Singapore. Journal of comparative economics, 30(3), 603-619.