Introduction
A thermoelectric cooler (TEC) is an electric garget that contains a p-n junction necessary for creating a temperature gradient between the surfaces of the junctions (Tse, 1989). TEC is a dual purpose garget that can be used to either generate current courtesy of a temperature difference on the surfaces of the junction or, conversely create a temperature difference by the virtue of an external voltage. The later application, also called the Peltier effect, is necessary for causing a cooling effect thus maintaining the vital temperature conditions important in processing. With respect to the Peltier effect, a temperature gradient is created owing to the temperature differences between the surfaces of the junctions after an application of an external potential difference (Tse, 1989). According to Liptak (2001), heat is absorbed and liberated at the surfaces of the junction causing cooling and a heating effect respectively. Therefore, this is the uniqueness of this cooling system whereby, the heat is transferred from the colder region to the hotter region. The temperature gradient causes migration of charge carriers (holes and electrons) within the p-n junction generating a thermal current (Tse, 1989). Depending on the polarity of the junctions, one can either achieve a heating or a cooling effect. However, the spontaneity of the heat transfer after an external voltage application depends on the compatibility of the Peltier coefficients of the p and n junctions (Norman, 1997). Otherwise, the system is subject to cease performing its intended function. TEC’s have a wide scope of application as far as cooling is concerned. Thermoelectric coolers find their applications in the tourism industry, medical industry and, also used as dehumidifiers among other applications (Liptak, 2001). TEC’s have an edge over conventional Carnot cycle refrigerators because of their portability, precision with respect to temperature steadiness (±0.05) and, maintenance-free nature (Norman, 1997). In order to design an effective TEC necessary to maintain a given condition, the designer should look at the components making up the TEC and optimize them. In this case, it is necessary that the material for the heat sink is tested to ascertain the best material for the purpose. The best current, the size of the heat sink and, the time taken to attain and maintain the right temperature is equally important to avoid temperature fluctuations. The remainder of the report is structured such that we focus on; the methods and materials for the experiments, results and analysis and, discussion and conclusion. The final part is the bibliography page necessary for reference purposes.
Materials and Methods Experiment 1: Effect of current on temperature difference created by a TEC
Materials
TEC assembly, copper heat sink, copper heat sink paste, Thermocouple, dc source, and an ammeter
Method
TEC assembly was attached to the copper heat sink using heat sink paste. The heat sink paste was then attached to the thermocouple before attaching it to the cold and hot surfaces of TEC. TEC was then attached to the dc source and the ammeter adjusted to a current of 0.1A. The corresponding value of temperature difference was then recorded. The current was then adjusted to different values, recording the respective values of temperature differences in table 1 below. An allowance of a 3 minute time-lapse was given for the temperature to steady before recording. A graph of the temperature difference between the cold surface of the TEC and the heat sink versus current was then plotted to obtain the relationship between the two (graph 1). The maximum temperature difference was also obtained when the current was 1.2A.
Experiment 2: Effect of size of heat sinks
Materials: timber, aluminum heat sinks of different sizes, thermocouple, aluminum heat sink paste, dc source and an ammeter.
Method
Heat sink paste was attached to the thermocouple and later on attached to an aluminum sink and the cold surface of TEC. The current of the TEC was then fixed at 1.0A and, the corresponding values of temperatures were recorded 3 minutes later. The procedure was then repeated for the different values of heat sink sizes and the values recorded in table 3 below. As a precaution, the heat sinks and TEC temperatures were set at room temperatures before the start of the experiments. A graph of the temperature of the cold surface versus the volume of the heat sink was plotted to obtain the relationship between the two (graph 2).
Experiment 3: Effect of heat sink materials. Materials: congruent sinks made of different materials, corresponding heat sink
Pastes, thermocouple, dc source, timer, and an ammeter
Method
The same procedure as experiment 2 was performed with the difference being the materials used for the heat sinks. As a precaution, the heat sinks and TEC temperatures were set at room temperatures before the start of the experiments. The material that gave the lowest temperature for the cold surface of TEC was then established (table 2).
Experiment 4: System design using thermoelectric coolers
Materials: copper calorimeter, thermometer, an Ammeter, heat sinks, timer, water, and ice.
Method
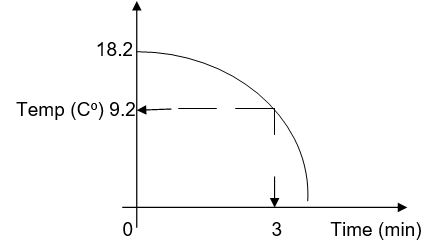
A design of the TEC was developed using brass material having a capacity of 25cm3. A 40 gram mass of water inside the calorimeter was then placed on the cold surface of the TEC and then the TEC was set to a current of 0.5A. The initial temperature of the water was taken prior to switching on the current and, after 3 minutes a final temperature was recorded. The procedure was repeated for different values of current and, also after heat sink modification with ice. The values were then recorded in table 4 below to obtain the best combination. For appropriate exposure time for the beverage, the water was placed in the calorimeter on the cold surface of the TEC and the temperature difference was recorded after every three minutes. The values were then recorded in table 5 below. A relationship between the exposure time and the temperature was obtained as shown in graph 3 below.
Results and Analysis
Table 1: effect of current on the temp difference
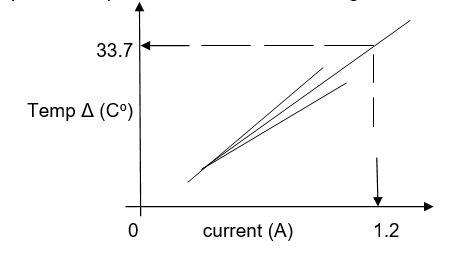
Table 2: Effect of temperature on the material
Table 3: effect of heat sink size on the temperature of the cold surface
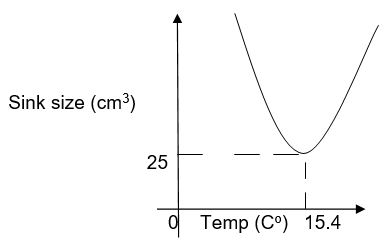
Table 4: Appropriate design of the TEC system capable of meeting the set condition.
Table 5: showing the effect of exposure time on the temperature of both water and TEC
Discussion and conclusion
There is a linear relationship between the change in current and the temperature change as attested by graph 1 above. The relationship is such that as the current increases, the temperature change also increases. The parameter is vital since it enables one to choose the correct current that suits the temperature condition under a given time of operation. As presented by an extrapolation of the graph, at a current of 3A, the temperature change of 33.7 Co is realized after 3 minutes. It, therefore, follows that the rate of temperature change is proportional to the current. The best material that showed an appropriate temperature after a 3 minute exposure time was brass with a temperature of 10.80 C. Its rate of heat transfer is the best for the design. The trend of the size of heat sink against temperature change assumed a parabolic shape, having an optimal performance at a volume of 25 cm3 achieving the best temperature of 15.4 as shown in graph 2 above. After combining the best parameters suitable for maintaining a temperature condition of 100C, the heat sink 2 gave the best results of 8.2oC at a current of 0.8 A after an exposure time of 3 minutes. Beyond a period of 3 minutes, the rate of temperature drop increases as shown by graph 3 above. At an exposure time of 3 minutes, the best temperature was 9.20C. In a conclusion, the best combination for the design is the one designed using brass metal for the heat sink, having a heat sink of 25cm3 and, performing at a current of 0.8A for three minutes when starting with a beverage at room temperature.
References
Liptak, G. B. (2001) Instrument Engineers’ Handbook: Process control and optimization. New York NY: CRC Press.
Norman, A. A. (1997) Instrumentation for process measurement and control (3rd ed), CRC Press.
Tse, S.F., & Morse, E. I. (1989) Measurement and instrumentation in engineering: principles and basic laboratory experiments. M. Dekker Publisher.