Abstract
For any building project, an electrical layout for the building (ELB) is required to give the construction engineers the map of the building. However, the approvals delay the construction project as they take extensive time to implement. The main problem is that the majority of organizations hire incompetent consultants who design defective ELBs that do not match the authority prerequisites. The research aims at improving the consultant’s electrical drawing for the building by implementing Lean Six Sigma (DMAIC) for the Authority in UAE to reduce the approval time. The acquisition of approvals ensures honest consultants, who ensure the utilization of safe and standard methods, including electrical layouts. The methods used in the research include lean Six Sigma techniques, such as DMAIC, interviews and field observations. The literature review section provides extensive information about Lean Six Sigma methodology and highlights the weaknesses and strengths of the sources used. The key research objectives include identifying the main reasons for delays in the construction projects, identifying the root causes of the electrical layout defects and investigating the application of DMAIC methodology in improving the technical drawing process. The expected outcome includes reducing the ELB errors, thus an immediate enhancement of the construction process.
Introduction
All the structural buildings require to be accomplished in a specified time and schedule. However, there are many people involved in such project works including authorities, contractors, designers, clients, and suppliers, who share the same goal of reducing costs and delivery time. The construction project delay has many consequences such as cost and overrun, stress among the contractors, disputes for all involved parties, and poor-quality work due to rush. In order to eliminate the ramifications and derive the benefits, there is a need to minimize the construction project delays (Rachid et al., 2019). Many building clients frequently become frustrated with the electrical outlet’s locations or anticipate changing the switch position in the building. To a greater extent, that is why electrical structural engineers develop an electrical plan (electrical drawing), which is the rough layout of what a building’s electrical system resembles before installation to avoid construction delays. The electrical drawing is not only essential to the electrical engineer but also to the customer (Adelakun et al., 2020). Not acquiring the electrical layout for building (ELB) causes project delay, which negatively affects the success of the entire project.
Significantly, a technical drawing refers to a visual representation of where all the building’s electrical points need to be situated. Therefore, it describes the number of switches, sockets, circuits, and outlet locations. Despite that, it showcases entire electrical appliances and lighting fixtures. Different symbols become utilized during the electrical plan to highlight which materials need to be utilized at a given point, these symbols arrangement in the buildings massively determines the electrical drawing. A study by Adelakun et al. (2020) showed that electrical drawing is essential as it ensures building safety because it enables the electrical system to run smoothly and safely. Having an electrical diagram enables all the crucial electrical preparation processes to complete before moving to another step of constructing the building.
However, most of the ELB that is done by the consultants contain massive errors and defects, both in the design itself and the electrical calculations, which can cause building electrical unsafety to the occupants of the buildings. The consultants are responsible for designing the building hole electricity, which is to be submitted to the authority. In that process, the electrical engineer conducts an electrical drawing audit to ensure that the layout meets the authority requirements for approval. Otherwise, the electrical engineer who’s working in the authority gives feedback regarding the electrical design and calculation for the electrical drawing consultants, for example, calculating the proper breaker (CB) and type of CB, among other calculations, including capacitor bank. Such errors give the electrical engineer much time to revise the design, deterring their approvals and may result in financial losses before sending the consultant to fix the technical drawings (Kamal et al., 2020). The delays in getting approvals also lead to setbacks, including construction process delays. The defects in electrical drawings can be attributed to inexperienced consultant engineers, who have higher job ratings and have not familiarized themselves with large building projects.
The building construction companies are currently operating in an increasingly competitive marketplace. Regardless of their size and experience, they are forced daily to offer the highest quality electrical diagrams with no defects. Companies failing to enhance productivity, quality, and client satisfaction encounter a bleak future whereby business rivals overtake their market share, resulting in huge financial losses. The business contracting consultants need to offer them the best guidelines and measures to compete effectively in this construction-changing environment. In our case, for the consultants to fix the errors in their electrical drawings, they are required to execute a fixed methodology, such as Lean Six Sigma (DMAIC), to attain vast improvements in productivity, quality, and client satisfaction (Sreedharan et al., 2018). One of the biggest concerns with the consultants working in Construction companies is to eliminate defects, like electrical drawing calculation and design errors, which delay the project approvals. In that case, the firm consultants waste their resources and time reworking the ELB process and lose the client’s trust and satisfaction due to the delayed construction process (National Academies of Sciences, Engineering, and Medicine, 2017). The companies and consultants need to improve the quality of their technical drawings processes to create a strong business strategic advantage and introduce themselves as an international firm for further prospects. This study examines electrical drawings quality issues and offers a solution to minimize the most critical errors. In order to attain this, the study proposal advocates for the use of the most effective quality management and improvement methodology, that is, Lean Six Sigma, in particular DMAIC (Define, Measure, Analyze, Improve, Control) as a problem-solving and improvement model.
The study undertakes a literature review of DMAIC, indicating the positive impact and benefits of the theory on the electrical drawing on eliminating defects for its quick approval. Therefore, the study aims at enhancing the electrical technical drawings undertaken by the consultants. By integrating and executing lean Sigma (DMAIC) to the ELBs, the study outcomes will have reduced ELB auditing for the electrical engineers in the authority, which will improve the construction process due to approving it in a shorter time.
The research report for the study will involve the literature review, which will discuss the major accomplishments in the ELBs in buildings, the use of DMAIC tools, causes of project delays, research gap, and provide critical discussion. The report will have research methods, the study aims and objectives, and provide a feasible case study directed towards improving the electrical drawing for the buildings to reduce the approval time and minimize construction project delays.
Literature Review
Major Accomplishments in Electrical Layout for Buildings
According to (Sreedharan et al., 2018) over the several years, the electrical drawings have improved from manual designing and calculations to specialized software, which aids in minimizing the layout errors. The availability of the maps has made the electricians and other construction workers have full detail on how to install and repair the electrical systems. Over the years, several building approval agencies have been developed to ensure that the building adheres to the standards to ensure the safety of the occupants. In that case, most companies have invested in having highly trained and qualified engineer consultants to develop the best electrical layout for building (ELBs) (Saldarriaga et al., 2019). The literature pinpointed the role of approval authorities in designing the best ELBS, but it did not showcase how the approvals assist in reducing layout errors.
A study done by Zarei et al. (2018) shows that with internal and external consultations, the errors and defects associated with electrical drawings are effectively tackled to enable approval for beginning the building construction process. The availability of computers and computation software has increasingly led to effective technical drawings. In that case, the technical diagrams contain extensive databases regarding the site plan, including external wiring, floor plans, and structural location. A study by Sreedharan et al. (2018) showed that wiring diagrams have a blueprint of electrical circuits and their physical connection. The literature identified defects for ELBs for buildings, but it did not offer recommendations to improve or eliminate the errors.
According to the statistical reports, the entire ELBs must embed comprehensive details, including light fixtures, power transformers, the main and fused switches, and the tiebreakers. Other information necessary to integrate in the technical drawings includes the interconnection and switching of the electrical system parts, such as electrical wires and calculating size and voltage of equipment, like generators, batteries, and solar panels (Madsen & Madsen, 2016). Such measures have been implemented to eliminate design errors associated with electrical drawings (Saldarriaga et al., 2019). The literature identified the primary components of ELBs, but it did not show their absence causes delay in construction projects.
Different researches have been done on how to improve electrical drawings. However, the available literature does not indicate how much electrical drawing errors cause delays in approval leading to increased construction process wait-time (Sreedharan et al., 2018). All the components of wiring diagrams should be designed error-free to ensure the quickest approval of the projects (Madsen & Madsen, 2016). Multiple research advocates for interscapular knowledge exchange, whereby the qualified engineers of the client company and the consultants work together to attain non-defective technical drawings during the design. The study does not provide data on how technical diagram errors cause construction project delays, but it advocates for interdisciplinary fields working together.
The Use of Lean Six Sigma (DMAIC) in the Construction Field
Literature has advocated using the DMAIC tool and technique to improve the wiring diagrams, which deploys other quality and improved performance models, including control plan, measurement system analysis, Pareto chart, fishbone diagram, and capability analysis. The DMAIC approach usage helps analyze a process before implementation, which enables the fixation of a wrong issue that can impact the whole project (Wogan et al., 2017). The use of the DMAIC process during the ELB approval by authorities can minimize construction project delays leading to their success. The phenomenon results in general performance improvement and ultimately filtering such through to happier clients. Through rectifying the electrical drawing defects, the literature suggested methods, including DMAIC, ensure improvement of the process, minimizing the approval delays and recurrent reworking (Newbery et al., 2021). The literature gives statistics on the importance of using the DMAIC tool.
According to Wogan et al. (2017), despite improving the design quality, the Lean Six Sigma (DMAIC) acts as a management strategy and philosophy applied to each process, like electrical drawing, to abolish the error root causes. To a greater extent, several authors argue that the primary advantages to the building electrical design development companies from applying the Six Sigma. They include defects elimination, cycle time improvements, cost reduction, rise in profits, and improved customer experience. The literature suggests that the DMAIC methodology becomes utilized in design process enhancement. It can be expanded to improve other business elements, including legal and purchasing, attached with electrical drawings. Incorporating DMAIC with other techniques helps in encouraging employee participation in the project, increases the process knowledge of the less qualified and inexperienced building specialists, and engenders problem-solving by using statistical thinking concepts (Bhawika et al., 2019). The literature does not give the names of other techniques to be incorporated with DMAIC to improve construction delays despite identifying the root causes of ELB failure.
According to diverse research undertaken, using DMAIC in this research project will enable all the individuals involved in the electrical diagram to enhance their skills and knowledge, thus effectively solving problems through gained statistical expertise (Hsu et al., 2017). Therefore, all the consultant engineers receiving high stars despite having decreased ratings will have improved experience in improving the electrical drawings, making them error-free. The study will benefit from the five interlinked phases: define, measure, analyze, improve, and control. The literature identifies DMAIC stages, but it does not show how they will reduce the project construction delays.
Regarding the define stage, this phase entails determining the project team’s responsibilities, customer requirements, and expectations, elaborating the project scope and limits and establishing the project’s identified goals using the project charter (Wogan et al., 2017). The other step involves mapping the electrical drawing process to help comprehend the defects in the implemented design. The ‘measure’ DMAIC stage involves choosing the measurement factors to be enhanced, offering a structure to assess pre-existing performance, and evaluating, contrasting, and monitoring subsequent improvements and capability. The frequent revision of electricity drawings shows that the operations failure costs exceed the target of escalated design defects over time due to denied approvals (Newbery et al., 2021).
The study done by Riva et al. (2019) indicates that it is essential to prioritize the causes of frequent electricity design process failures. This can be achieved by integrating the Pareto chart to showcase the highest triggers of the wiring diagram errors, which the design quality inspector might not detect. The ‘analyze’ phase focuses on determining the problem’s root causes, comprehending why defects have occurred, and comparing and prioritizing chances for better advancement. The study encourages the incorporation of a fish-borne (cause-effect) diagram to pinpoint the root causes of the electrical drawing failure. Improper design maintenance and poor process release procedure can contribute to such defects. The ‘improve’ stage concentrates on deploying. statistical techniques to create future improvements to minimize the number of quality issues. Last is the control phase, which focuses on sustainability enhancements and monitoring the ongoing performance. The stage enables institutionalization and documentation of ELB improvements through training wiring operators on the newly used tools and the current modified processes and updating the control plan, which is essential for this project. The literature gives a vivid description of each DMAIC process phase and the attached advantages in minimizing the construction delays of the ELB for building.
Technical Drawing Problem Improvement by other Sources
Several study sources have developed ways to improve the problem of quality electricity diagrams, which have resulted in faster approvals. Literature suggests using Deming’s continuous learning and process enhancement model plan-do-check-act (PDCA) (Realyvásquez et al., 2018). Despite PDCA being a learning model intended for executing advancement activities, it also envisions data collection and analysis directed towards finding the problem associated with electricity layout. The literature fails to compare PDCA with DMAIC to showcase which is more effective in reducing construction delays despite giving its benefits to improve ELB.
According to literature, such a phenomenon enables project team members to take decisions and courses of action grounded on actual and scientific statistics instead of relying on personal knowledge and experience, as with many consultation wiring companies. The literature does not highlight the effective decisions to be undertaken by the project team despite advocating for the same.
Causes of Construction Project Delays
According to Ren et al. (2021), there are many causes of construction project delays. The first one is budget inaccuracies. A building project’s budget might suffer greatly if an incorrect estimate is provided. In order to avoid overspending, estimates must be accurate. Software streamlining bids, estimates, and financial project planning make the process less risky. As a result, contractors need a simple method to enter the job into their construction management platform and start to work. Real-time access to data is essential after the work is started to assess how progress is compared to expenses. The literature provided the causes of project delay but fails to show how they should be effectively implemented to realize results.
According to Umar (2018), laborers abstaining from the construction work is a major cause of building delays in the modern-day. While many skilled individuals laid off during the crisis could find employment in other areas, the downturn impacted this business. Construction jobs have seen a decline in popularity among newer employees entering the market. That dynamic is shifting due to the use of technology to streamline human resources and labor management processes in construction companies. Building a construction schedule may be made or broken by correctly assigning a team.
Approvals also cause construction delays. The government authorities require buildings, particularly commercial, industrial, and residential buildings, to have permits. Lack of compliance with the requirements may cause approval denial; thus, construction increases wait time (Ren et al., 2021). The project obstruction is frequently caused by overreliance of experts in each stage due to the paperwork involved and their reluctance in executing their duties and responsibilities (Bhawika et al., 2019). When owners are in charge of a project, they have to make choices that keep it going forward. Keeping construction projects on schedule and within budget may be achieved by swiftly coordinating and approving tasks. The literature indicated how approvals cause project delay and their benefits but fails to highlight the attached consequences if not acquired.
A study done by Wogan et al. (2017), indicates that every following task on the construction site might be delayed if a subcontractor is overworked or uninformed of the timeframe for the bigger project. There is an increased possibility of legal challenges or disputes if a contractor is not in compliance with their bonding, license, or other contractual requirements. In order to ensure that initiatives go off without a hitch, open communication is crucial. The literature indicated how a subcontractor causes project delay but fails to highlight the attached consequences.
According to Ren et al. (2021), Projects might be delayed or even done wrong if the right and left hands aren’t communicating. It does not matter whether it’s an owner, customer, in the field, or the office; everyone should be kept up to speed on any new information that comes to light. In a disagreement, the general contractor may rely on the communication and cooperation audit trails to ensure that teams have all the information they need to address problems before they become a project problem. The literature showed how lack of communication causes building delay but it fails to show how it affects the success of the whole construction project. Table 1 will summarize the most important reasons for construction delay and the sources of information.
Table 1. causes of construction delay and the source of information
General Applications of Lean Six Sigma
According to Rosa and Broday (2018), most companies, such as healthcare, manufacturing, business, and customer marketing enterprises, apply the lean six sigma model in their daily activities. Car production firms deploy the approach to help them reduce costs and increase profitability. DMAIC six sigma focuses on process improvement, waste elimination, and inventory reduction. The methodology philosophy emphasizes maximizing the available resources, particularly in production firms, to help them identify the most crucial problems that may affect their manufacturing undertakings. The operational efficiency improvement creates awareness for the team. In manufacturing entities, the lean six sigma method is applied to create flow after pinpointing, specification, and mapping a given item’s value stream. Therefore, it facilitates product manufacturing completion and the general improvement of the cycle lead time, creating ceaseless work elements flow with stoppages and frequent queues. The literature pinpointed how manufacturing industries can apply lean six sigma to reduce costs and eliminate waste, but it failed to showcase methodology demerits when deploying it.
A study by Chiarini and Kumar (2021) showed that many business organizations applying the lean six sigma method create products per the market value expectations or according to customer’s perceptions to minimize complaints. During marketing, the lean model is applied to analyze the processes determining the release of a commodity to consumers. Companies continue to receive negative feedback, particularly when customer satisfaction level deteriorates. The availability of feasible assembly lines is crucial in achieving smooth production system operation and flexibility. Lean six sigma methodology can enhance an item’s quality and fast delivery to the market at an optimum price, thus aiding firms in exceeding projected clients’ demands. The literature offers a description of how lean six sigma is applied in business organizations to minimize customer grievances and increase their level of satisfaction.
Lean Six Sigma Applications in Process Time Reduction
One of the most effectively established strategies and methodologies for increasing the speed of service and production industries is the lean six sigma model. The philosophy improves the momentum of entire processes across the firm to reduce wastage to enhance firm performance. Typical waste types that increase operational time include inventory, extra-processing, defects, motion, transportation, waiting, overproduction, and non-utilization of talents (Makwana and Patange, 2021). Lean six sigma deploys various statistical techniques and tools and integrates a group of qualified experts to improve total quality management. The complicated areas are well managed, and the errors are tackled earlier. The minimization of wastes and defectives and streamlining value flow results in time reduction. The method leads to proper deployment of lean thinking, rectifying a slow process by developing a well-structured blueprint to reduce variability (Trakulsunti et al., 2022). In the ELB, lean six sigma methodology can be successfully applied to reduce time by eliminating defects that cause reworking. The literature indicated how lean methodology helps eliminate waste resulting in time reduction but fails to highlight the attached repercussions of not utilizing the method.
The lean six sigma tools and principles serve as the most systematic and organized techniques to the obstacle of cycle time reduction. The method enables effective allocation of duties and responsibilities to the personnel involved in a particular project, leading to increased commitment and fixation on the immediate arising issues (Honda et al., 2018). The highly qualified group leaders train others without seeking external consultation. Application of the lean model leads to a review of existing workflow, updates on processes, dedication to scheduled maintenance, and maintaining optimal inventory, which helps minimize time spent on a certain activity (Trakulsunti et al., 2022). The literature showed how qualified experts could offer support to their subordinates and the standardized process of lean sigma to reduce time reduction. In addition, the method helps measure the total setup time for the electrical drawing, pinpoint the external and internal components, and standardize new procedures to reduce the period of accomplishing the product development or project completion.
Lean Six Sigma Applications to Reduce Rework and Defects
A study by Thapa et al. (2018) showed that the lean six sigma application substantially assists in defects and rework reduction by gathering enough data about an error and how to rectify it. The lean sigma helps define the problem, measure the deviation using control plans, analyze the root causes, and set countermeasures to minimize the established defects and enhance operational efficiency. Some notable errors with building projects include poor design resulting from incompetent and unqualified personnel. Lean six sigma reduces variations and waste defects, which causes delays in the completion of a house construction project. The methodology helps create waste reduction phases to improve the timely delivery of the final product to the client. Most forms of defects eliminated through the application of lean methodology include rejects, movement, extra processing, movement, inventory, and waiting (Rezaei et al., 2019). The model gives a better and newer viewpoint of examining problems and developing improved ways to solve them. The quality experts design a blueprint for their planned project’s to avoid recurrent reworking. The literature indicated how lean six sigma could be applied to minimize defects and reworks, but it did not show the impact of not utilizing the methodology.
Research Gap
The research gap identified is that there are no studies on electrical drawings failure and the impact on permit approval acquisition. The topic requires future research as electricity diagram defects make the company not obtain approval, thus delaying the construction process (Tariq et al., 2020). In modern society, the acquisition of construction wiring permits is crucial to ensure the future safety of residents and enable countering electricity fire hazards adequately in case they occur.
Research PURPOSE and Objectives
Research Aim
The research aims to improve electrical drawings for buildings via Lean Six Sigma (DMAIC) implementation to avoid construction project delay.
Research Objectives
There exist several research objectives that will guide in attaining the study aim. They include:
- To identify the main reasons for delays in the construction projects.
- To identify the root causes of the electrical layout drawings defects.
- To investigate the application of DMAIC methodology to minimize approval waiting time.
Methods
The research will be conducted by reviewing the literature and undertaking interviews. This will ensure the results obtained from the research indicate that utilization of the DMAIC is essential in improving the ELB to avoid construction project delays. The tools and techniques for collecting and analyzing data will include interviews, case studies, and observations. They will help preserve the information used in the future interpretation of the research findings (Prashar, 2020). According to a study done by Sarstedt et al. (2019), the research methodology diagram is essential as it guides the researcher on pinpointing the links between the study topics and earlier deployed methodologies by other investigators. It becomes easy to identify the research gap by using it. The data collection involving interview and carrying regression analysis helps in spotting any errors committed during calculating and designing ELBs. Figure1 represents the research methodology diagram that will be followed.
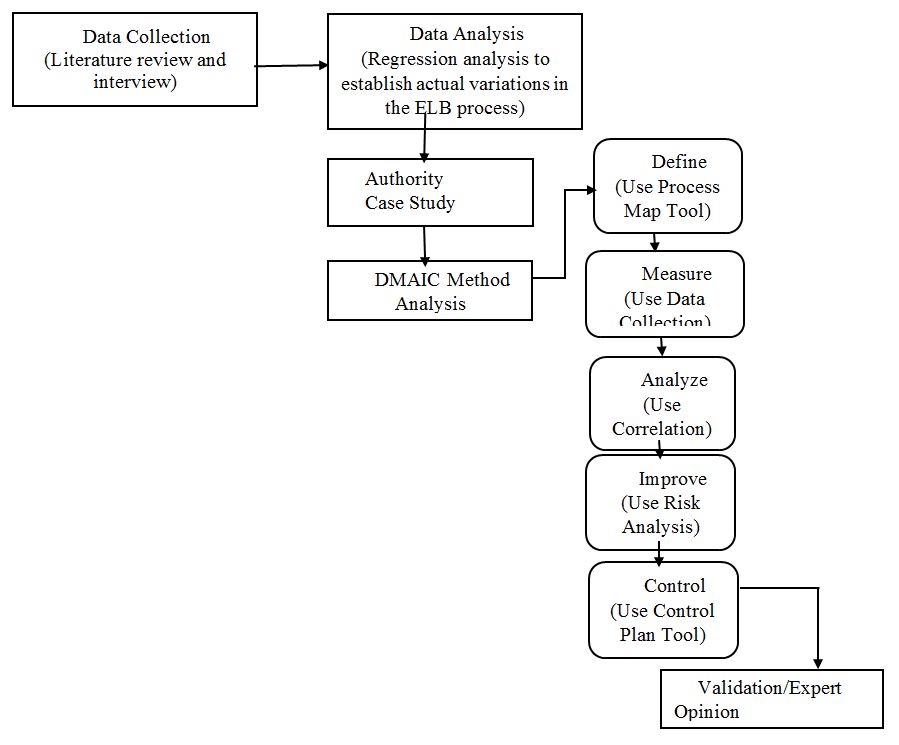
The data will be gathered through both primary and secondary data collection methods. After that, a regression analysis model will be used to establish the actual variations in the ELB process. In the authority case study, the DMAIC method will be used and each phase will use a different tool to ensure whether they will improve the ELB errors made by the consultants.
Primary Data Collection Method
Primary method involves data collection directly from the first-hand source by the researcher (Sarstedt et al., 2019). Primary data collection methods will include interviews and field observations. The interviews will be conducted with the electrical domain experts, including the consultant and engineers, to collect data. Moreover, discussing the most frequent errors in auditing ELBs. Secondly, through field observations of the technical drawings of ELBs, the data will be assembled regarding frequent errors. A schedule to indicate preparation indicating the number of consultants committing the most mistakes and the period for each case. In that case, the data will assist in enhancing the ELB auditing process and adopting them quickly.
Secondary Data Collection Method
The secondary method involves acquiring information by someone instead of the actual user, thus being readily available for use (Prashar, 2020). Regarding the secondary data collection method, the literature review from journals, conference papers, and databases, including SCOPUS, EBSCO, Proquest, and Google Scholar, will be used to gather information by reviewing twenty sources. The DEWA Circular & Regulation Book as well as, SEWA Rules and Regulation Book will be used to gather data as it gives massive information regarding the company in the study question. The checklist comprises the main rules and regulations that are related to electrical supplies in the building.
Data Analysis
In data analysis, statistical analysis will be applied such as regression, correlation and ANOVA. This will help establish the real causes of variations in the ELB process. In that case, the impact of one variable over the other will be measured and authenticate or disapprove available hypotheses on what is causing the frequent electrical drawing defects (Sarstedt et al., 2019). The solutions obtained will be formed and tested.
Case Study
In order to get a tangible, contextual, and in-depth understanding of an actual issue, a case study is the ideal research design. It gives one a chance to delve further into the case’s essential traits, meanings, and ramifications (Umar, 2018). The authority will be used as the case study. It is located in the United Arabs Emirates (UAE), and it is a government facility providing residents with water and electricity. It has over 4500 employees and over 35 branches countrywide. The authority is a state-owned enterprise type of business (Umar, 2018). The use of Lean Six Sigma (DMAIC) methodology will help to eliminate inconsistencies in the ELBs, when assessing and auditing ELBs from consultants to ensure they meet the requirements resulting in a shorter approval time. As a result of this achievement, project approval times will be reduced.
The ‘define’ phase will establish the project scope and limits and give team members duties. The process map tool is used in this initial DMAIC stage. The second phase is ‘measure, ‘which will identify the highest triggers of the ELB defects (Newbery et al., 2021). The data collection plan is deployed in the second process. In the ‘analyze’ phase, the root causes of the ELBY’s defects and failures will be established and adopting strategies for improving them. The correlation analysis used to identify the relationships between the variables. The ‘improve’ stage will be geared towards minimizing the quality issues of the ELBs. The management tools, including risk assessment, will be used to create future improvements. The ‘control’ phase will concentrate on sustainability and checking the ongoing performance (Riva et al., 2019). The control plan tool will be used in this phase to ensure documentation and institutionalization of ELB enhancements via training all wiring operators.
Initial Findings
Define Phase
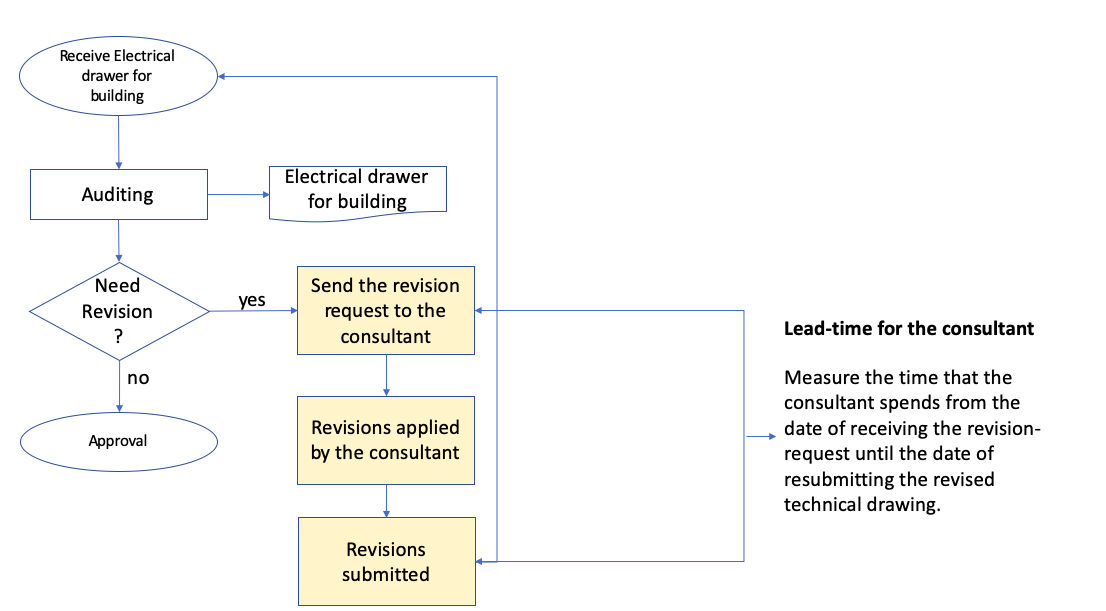
Limited experts in ELB-specialized companies monitor ELBs per the authority prerequisites. The research aims to resolve the issue of approval delays encountered by ELB and suggest improvements. Figure 3 showcases how many ELB approval revisions from the authority’s consultants cause time wastage. The case study shows that constant ELB revisions indicate that the consultants are developing defective electrical for the clients, which may cause fire and deny the accessibility to the plan during an emergency. After rectifying, the client’s safety is enhanced as they receive a building free from electrical defects. The primary problem is approval delays due to non-compliant ELBs done by consultants. The issue can be pinpointed by undertaking ELB auditing and stabling whether they need revisions. The occurrence of revisions showcases a present issue that needs to be corrected. Undertaking Figure 3 illustrates the process map for the defined phase.
Measure Phase
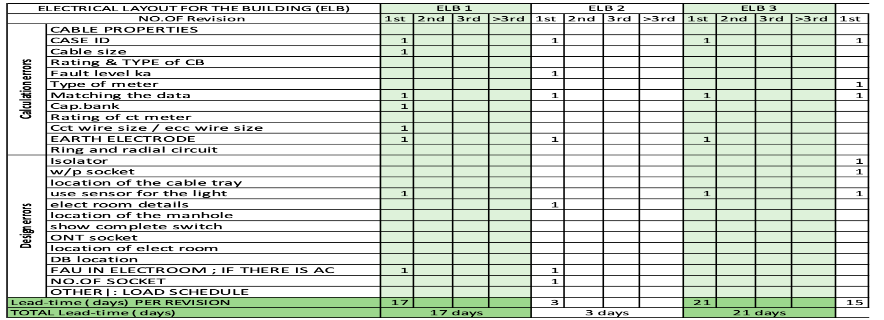
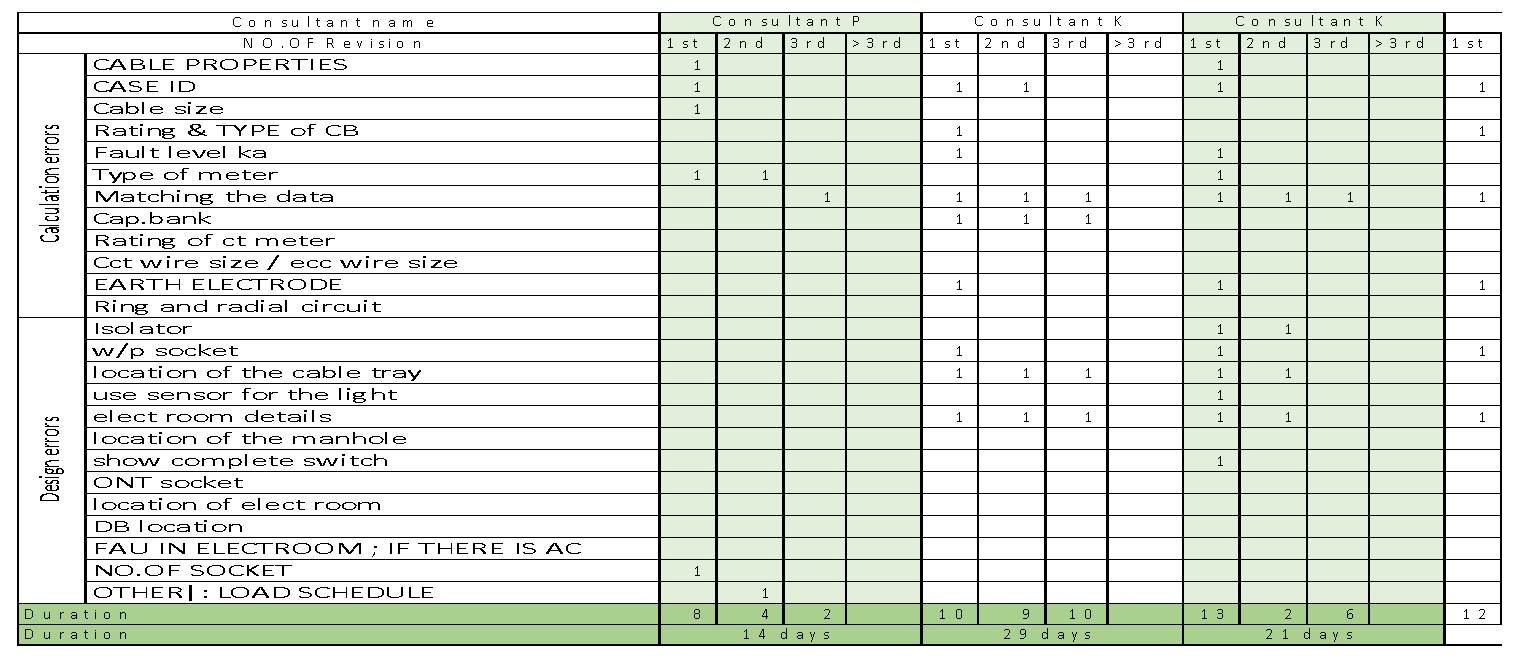
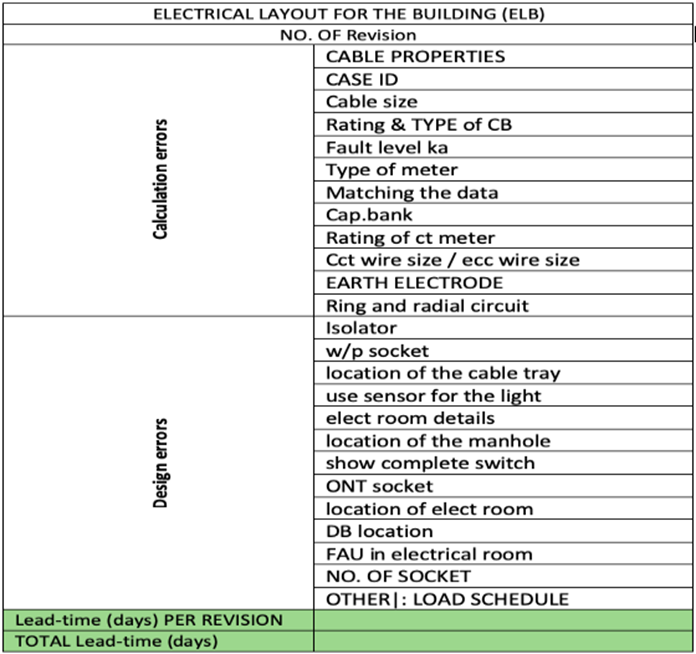
An employee with direct information flow from the authority gathered the available data. The worker determined the time taken for ELB approval and the number of faults in each ELB committed by every authority’s consultant. [Refer to Appendix A]. The data on cable properties, rating, and type of cable, ID and size, type of meters, and the number of required sockets, will be needed to reduce the approval and auditing time for the ELB by the consultants. Some calculation errors include earth electrode, matching the data, and rating of ct meter, while design faults are isolator, manhole location, and DB location. Lead times will be measured in days, while the total number of units will be measured in whole numbers. Figure 4 illustrates the data set for the number of ELB revisions.
The data gathered and measured indicate that matching data involves a parameter with optimum approval and auditing number of days (43). Table 2 showcases data error matching as the ELB process entails electrical cables and wires mismatch, which consumes the consultant’s time. In addition, the elect room and DB location areas (with 0 faults) have fewer errors, as the consultant easily analyzed how they relate to the building’s general layout. The elect room location has a minimum value of 0, as this certain error results in financial fees and a lower chance of escalating faults. The average lead time (time taken to establish faults) was 17.5161 (obtained by computing the average of all lead times). Several locations such as ELB1, ELB2, ELB4, ELB5, ELB6, ELB7, ELB8, ELB10, ELB11, ELB12, ELB15, ELB17, ELB18, ELB22, ELB23, ELB24, and ELB24 have lead times below average. In summary, a total of 17 tests have a lead time below the average. The test cases, including ELB3, ELB9, ELB14, ELB16, ELB17, ELB19, ELB20, ELB21, ELB25, ELB26, ELB28, ELB29, ELB30, and ELB31, have lead times equivalent to or above 18.275862 days.
As evidenced, most delays in obtaining ELB approvals arise from auditing and non-compliance as the 1 value for consultants involved. The sophisticated calculation and measurement tasks required make the consultants perform crucial mistakes. For example, this aspect makes consultant J take 46 days to get ELB approval and is mandated to ensure that the layout measurement is within the standard ranges, prompting them to make errors. From the gathered data (attached in the appendix), most mistakes (about 43) are made by consultants through matching data on the ELBs. For this phase, the key activity is contrasting different types of defects arising from various parameters and relating to the number of days multiple chosen contractors take to audit and approve the ELB. The results involve the scores of various consultants and how different parameters cause errors to sprout.
Table 2. matching of data error
| Name | Picture | Description |
| Electrical layout |  |
|
| Load schedule |  |
|
| Single line diagram | 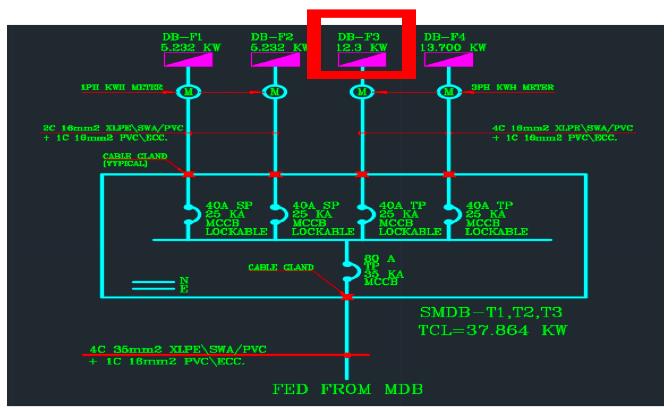 |
DB-F3 is 12.300kw |
Analyze Phase
The correlation analysis of two variables entailing the ELB errors caused by the consultant and the time needed to undertake revisions and rectifications is graphed in the analysis phase. Figure 5 shows a positive correlation between the number of days taken against the number of ELB revisions. Reducing the number of ELB revisions by the consultants can substantially lower the approval time taken and the period to rectify them.
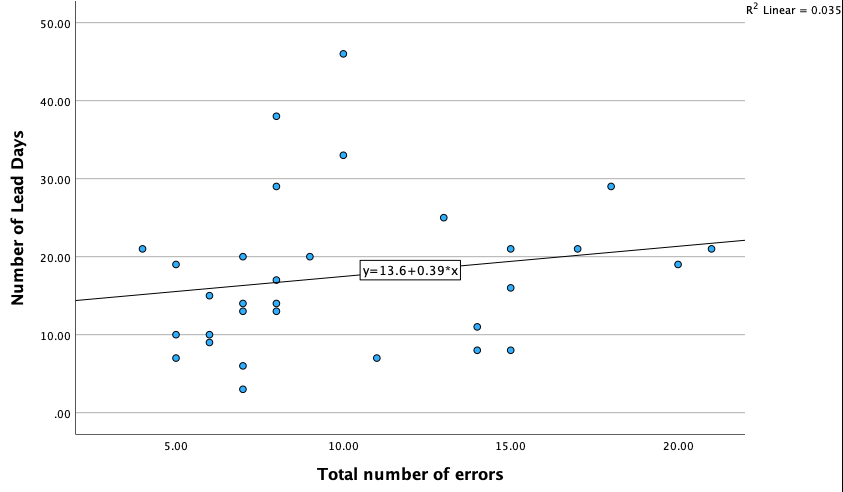
Figure 5 shows a positive correlation between the number of lead days and the total number of errors. The number of lead days and the number of errors observed are highly concentrated around the mean values for the respective parameters.
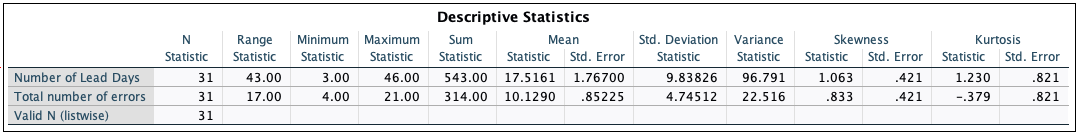
Figure 6 gives a descriptive analysis summary intended to determine the statistical significance between the number of lead days and identified number of faults. The total number of errors recorded in the analysis is 31 within the 31 lead days analyzed. In addition, the ranger of statistics is 43, with a maximum statistic value of 3 and a corresponding maximum of 46. The total number of variables/values included in this case is 543, with a mean value of 17.5161 and a standard error of 1.76700, indicating the samples are closely distributed to the standard mean. The standard deviation is 9.83826, with a statistical variance of 96.791. The large standard deviation indicates that the values are widely spread out, which is confirmed by the large variance. Regarding the skewness of the data analyzed, the standard error is 0.421 and a statistical value of 1.230, showcasing fewer errors. The kurtosis statistical value is 1.063, with a standard error of 0.833, implying the data set has a small tail.
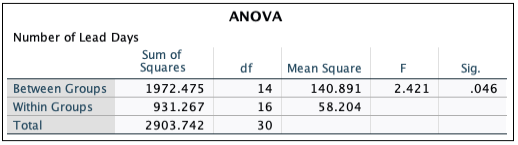
Figure 7 illustrates a variance analysis on the lead days, with the sum of squares within groups being 931.267 and between groups being 1972.475, and shows the deviation of values from the actual mean. The DF value (number of items considered) between groups is 14, while within groups is 16. The F ratio is the quotient of the respective mean squares, while sig represents the p-value. The sin value of 0.046 (below 0.05) indicates a high statistical significance.
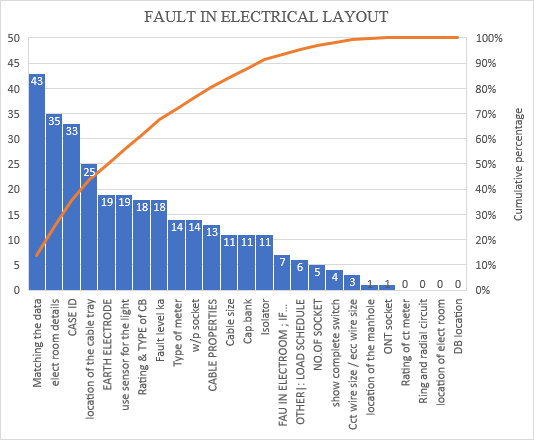
Figure 8 showcases the type of errors highly made in the ELB against the cumulative percentage that causes delays in approval. For example, the primary fault was matching data with 43 problems committed by the consultants, with the highest cumulative percentage of 85%. It is followed by Case ID, Erect room details, and the location of the cable tray in that order. The ONT socket, rating of ct meter, ring and radial circuit, location of the elect room, and DB location had 0 errors with a cumulative percentage of 0, indicating they were not recorded.
The Common Causes of the Errors Identified in the Case Study
- Processes, including matching data, involve electrical cables and wires mismatch, which consumes the consultant’s time. In addition, the procedure mandates the auditing personnel to follow all cables while adhering to the authority’s policies.
- The complexity of calculation and measurement activities required spearhead consultants to make crucial mistakes. For instance, this aspect makes consultant J take 46 days to get ELB approval and is mandated to ensure that the layout measurement is within the standard ranges, prompting them to make errors.
- The lack of prior knowledge on auditing ELB is another source of defects.
- In addition, most consultants frequently make repeat errors, including those associated with properties, cable size, and related mistakes, since they do electrical design per their experience and not according to the authority prerequisites.
- Lastly, grade 1-rated consultants engage in the duties of grade 4 consultants while they have minimal experience with large projects.
The manufacturing industry uses the “5-whys” technique to investigate the root causes of major problems (Chiriani, 2021). Figure 9 showcases the reasons for the delay time in ELB approval
Conclusion and Future Plan
To a greater extent, the ELB errors committed by the authority consultants tend to cause many revisions to obtain the approvals. The key findings established is that there is a stronger correlation between the number of ELB revisions undertaken by the consultant and the days taken. Some of the design and the calculation error committed by the consultant may take different lead times to rectify. In the measure stage, the duration required for the approval of the revised ELBs will be datamined. More data will be collected during the analyze phase to ensure the examined data reflects the actual root causes of the ELB errors. In the next semester, during the improvement phase, the researcher will construct likely solutions to the research problem, select and modify the best solutions, undertake test analysis, and document the key findings. Lastly, during the control phase, the obtained solutions will be validated and all related changes will be documented. After that, the investigator will write a comprehensive action plan, including the recommendations on what consultants need to do to avoid ELB defects for quick and direct approvals. The Gantt chart will illustrate a project timeline and progress for Project II [See Table 2].
Table 2. Gantt chart
References
Adelakun, N.O., Olanipekun, B.A. and Asogba, S.O. (2020) ‘Design of an electrical installation of a storey building’, International Journal of Engineering Technology Research & Management IJETRM, 4.
Bhawika, G.W. and Suef, M. (2019) ‘Acceleration for the administration process of project contract in power plant service company using DMAIC’, In Journal of Physics: Conference Series (Vol. 1175, No. 1, p. 012196). IOP Publishing.
Chiarini, A., & Kumar, M. (2021). ‘Lean six sigma and industry 4.0 integration for operational excellence: Evidence from Italian manufacturing companies’, Production Planning & Control, 32(13), pp.1084-1101.
Honda, A.C., Bernardo, V.Z., Gerolamo, M.C. and Davis, M.M. (2018). ‘How lean six sigma principles improve hospital performance’, Quality Management Journal, 25(2), pp.70-82.
Hsu, C.H., Chen, P.S. and Yang, C.M. (2017) ‘An application of six sigma for improving thee of power supply’, TELKOMNIKA Indonesian Journal of Electrical Engineering, 11(10), pp. 6087-6094.
Kamal, K.E., Hossian, A.M., Mohamed, M.A. and Ahmed, W.K. (2020) ‘Implementation of six sigma methodologies in automotive wiring harnesses manufacturing companies. “ABC” plant case study’.
Madsen, D.A. and Madsen, D.P. (2016). Engineering drawing and design. Cengage Learning.
Makwana, A.D. and Patange, G.S. (2021). ‘A methodical literature review on application of lean & six sigma in various industries’, Australian Journal of Mechanical Engineering, 19(1), pp.107-121.
National Academies of Sciences, Engineering, and Medicine (2017) Enhancing the resilience of the nation’s electricity system. National Academies Press.
Newbery, D., Pollitt, M.G., Ritz, R.A. and Strielkowski, W. (2018)’ Market design for a high-renewables European electricity system’, Renewable and Sustainable Energy Reviews, 91, pp. 695-707.
Pandey, P. and Pandey, M.M. (2021) Research methodology tools and techniques. Bridge Center.
Prashar, A. (2020) ‘Adopting Six Sigma DMAIC for environmental considerations in process industry environment’, The TQM Journal.
Rachid, Z., Toufik, B. and Mohammed, B. (2019) ‘Causes of schedule delays in construction projects in Algeria’, International Journal of Construction Management, 19(5), pp. 371-381.
Rezaei, A., Ehsanifar, M., & Wood, D. A. (2019). ‘Reducing welding repair requirements in refinery pressure vessel manufacturing: A case study applying six sigma principles’, International Journal on Interactive Design and Manufacturing, 13(3), pp.1089-1102.
Realyvásquez-Vargas, A., Arredondo-Soto, K.C., Carrillo-Gutiérrez, T. and Ravelo, G. (2018) ‘Applying the Plan-Do-Check-Act (PDCA) cycle to reduce the defects in the manufacturing industry. A case study’, Applied Sciences, 8(11), p. 2181.
Ren, X., Li, C., Ma, X., Chen, F., Wang, H., Sharma, A., Gaba, G.S. and Masud, M. (2021) ‘Design of multi-information fusion based intelligent electrical fire detection system for green buildings’, sustainability, 13(6), p. 3405.
Riva, F., Gardumi, F., Tognollo, A. and Colombo, E. (2019) ‘Soft-linking energy demand and optimisation models for local long-term electricity planning: an application to rural India’, Energy, 166, pp. 32-46.
Rosa, A. C. M., & Broday, E. E. (2018). ‘Comparative analysis between the industrial and service sectors: A literature review of the improvements obtained through the application of lean six sigma’, International Journal for Quality Research, 12(1), pp.227.
Saldarriaga-Cortés, C., Salazar, H., Moreno, R. and Jiménez-Estévez, G. (2019) ‘Stochastic planning of electricity and gas networks: an asynchronous column generation approach’, Applied energy, 233, pp. 1065-1077.
Sarstedt, M. and Mooi, E. (2019) Regression analysis. In A Concise Guide to Market Research (pp. 209-256). Springer, Berlin, Heidelberg.
Sreedharan V, R., Kannan S, S. and Trehan, R. (2018) ‘Defect reduction in an electrical parts manufacturer: a case study’, The TQM Journal, 30(6), pp. 650-678.
Tariq, S.H. and Ahmed, Z.N. (2020) ‘Effect of plan layout on electricity consumption to maintain thermal comfort in apartments of Dhaka’, Energy Efficiency, 13(6), pp. 1119-1133.
Thapa, R., Saldanha, S., & Prakash, R. (2018). ‘Application of the lean six-sigma approach to reduce biomedical equipment breakdown time and associated defects’, Journal of Evolution of Medical and Dental Sciences, 7(34), pp.3771-3779.
Trakulsunti, Y., Antony, J., Edgeman, R., Cudney, B., Dempsey, M. and Brennan, A. (2022). ‘Reducing pharmacy medication errors using Lean Six Sigma: A Thai hospital case study’, Total Quality Management & Business Excellence, 33(6), pp.664-682.
Umar, T. (2018) ‘Causes of delay in construction projects in Oman’, Middle East Journal of Management, 5(2), pp. 121-136.
Wogan, D., Pradhan, S. and Albardi, S. (2017) GCC energy system overview–2017. King Abdullah Petroleum Studies and Research Center: Riyadh, Saudi Arabia.
Zarei, B., Sharifi, H. and Chaghouee, Y. (2018) ‘Delay causes analysis in complex construction projects: A semantic network analysis approach’, Production Planning & Control, 29(1), pp. 29-40.
Appendices and Abbreviations
Appendix A. Data Set
Data Set for Number of Elb Revision