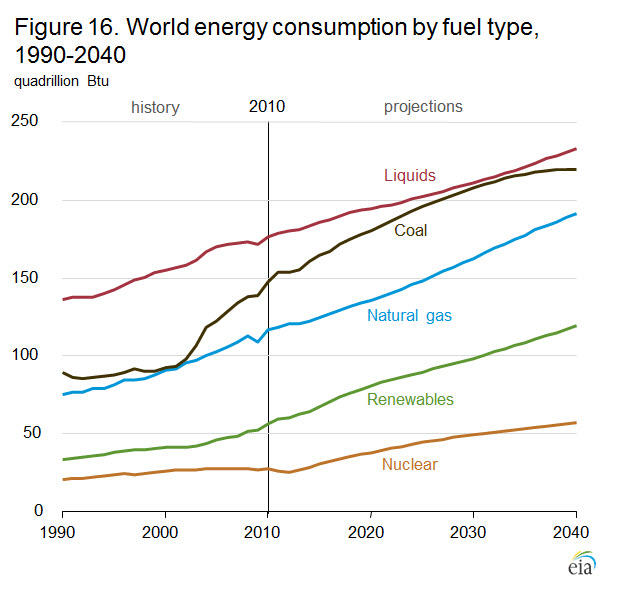
Fossil fuel energy consumption in the past decades
A 1995 report shows a significant increase in the consumption of fossil fuel between 1990 and 2014 (Kruger 2006). The consumption shows a notable increase in fossil fuel consumption, with coal registering the most significant increase compared with other sources of energy, as summarised in the graph below (Marland, Boden, Andres, Brenkert & Johnston, 2003).

Increase or decline
From the graph, the projected use of fossil fuels will experience steep rise before a slight decline occurs and then picks for coal in 2040 (Ramírez & Worrell 2006). Liquid fuels take the highest lead, followed by coal, natural gas, renewables, and nuclear energy (Boyle 2004). An increase in the global consumption of fossil was shown with different fuels showing a positive change of 1.3% in 2002 of 8, 034 million tons compared with a 0.3% increase in 2001, which is a rise of 4.7 times the value it was in 1950 (Laidler, Battles, Miller, Ackerman & Carls 1997).
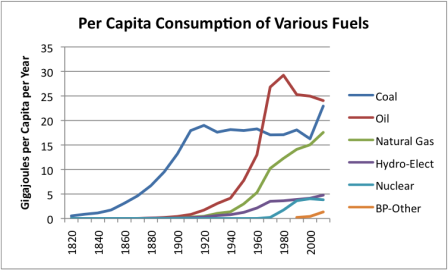
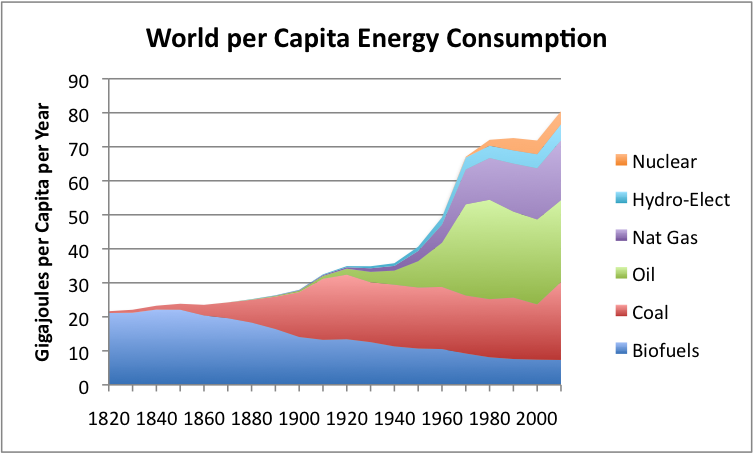
By 2002, there was a global increase of 2% consumption of oil, and the USA used 26% of the global oil, showing a slight decline of 0.7% for Japan, South Korea, New Zealand, Latin America, and Australia combined. An increase of 1.9% was recorded in 2002, where the US consumes 23% of the world’s coal in the market and China showing a consumption of 25% of the global reserves of coal (Lefohn, Husar & Husar 1999). At the same time, between 2001 and 2002, natural gas consumption rose by 2% in the US, which is over 4 times the current consumption, when compared with the consumption of the same fuel between 1950 and the present day (Menyah & Wolde-Rufael 2010). A slight increase in the energy per capita consumption prior to 1900 was because of the contribution of alternative sources of energy, which showed a slight decrease in the consumption of coal (Cooke & Wilson 1996).
The graph below shows the Per Capita consumption of various fuels in the world since 1820 to 2000.
AN overall assessment of the situation shows an increase of 11.1 billion tons consumption of fuel by 2007 compared with 3.8 billion tonnes in 1960 (Nordhaus & Yohe 1983). The percentage changes in fossil fuel consumption per region are shown in the table below (Shafiee & Topal 2009).
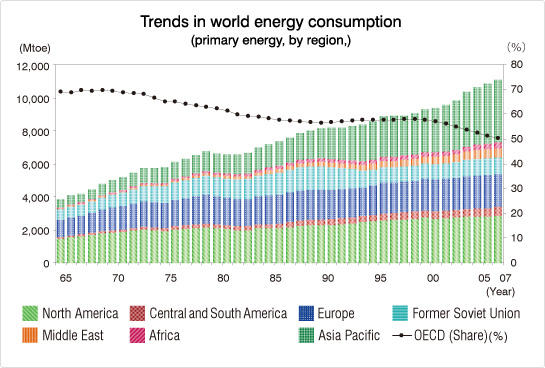
The graph shown above details the fossil fuel consumption per region in 2007.
Current Fossil fuel energy consumption
The United States and China are the leading fossil fuel consumers of fossil fuels in the world today (Turner 1999). Current trends show a 5.6 % increase in 2009 because of the economic recovery and an increase in the global demand for gas. The demand is in response to an increase in the demand for cleaner fossil fuels and a radical departure from the use of coal and other fossil fuels.
Decline or growth
While countries are looking for the best alternatives to fossil fuels, there is evidence to point out that the demand and use of fossil fuels will continue to increase instead of decreasing (Demirbas 2007). It is projected that by 2030, there will be an 84% growth in demand for fossil, with a consumption rate projected to increase by 1.2 % annually. In absolute terms, the consumption of coal will jump by 73% between 2005 and 20303(Eaves & Eaves 2004).
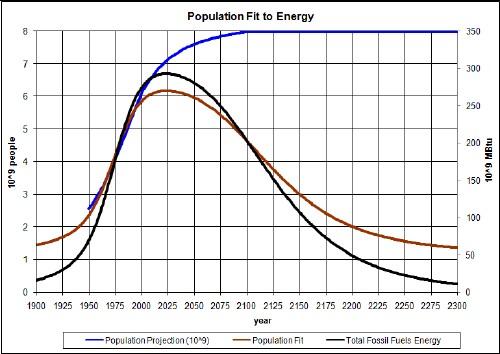
Past and current growth
The use of renewable energy has registered a significant growth as shown in the graph below over the years (Asif & Muneer 2007).
The growth has been positive with a slight decline in 2000.
Why?
Because of global economic decline which slowed the demand for the fossil files.
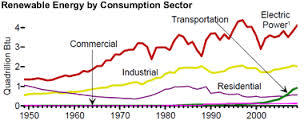
Renewable energy consumption in the past decades
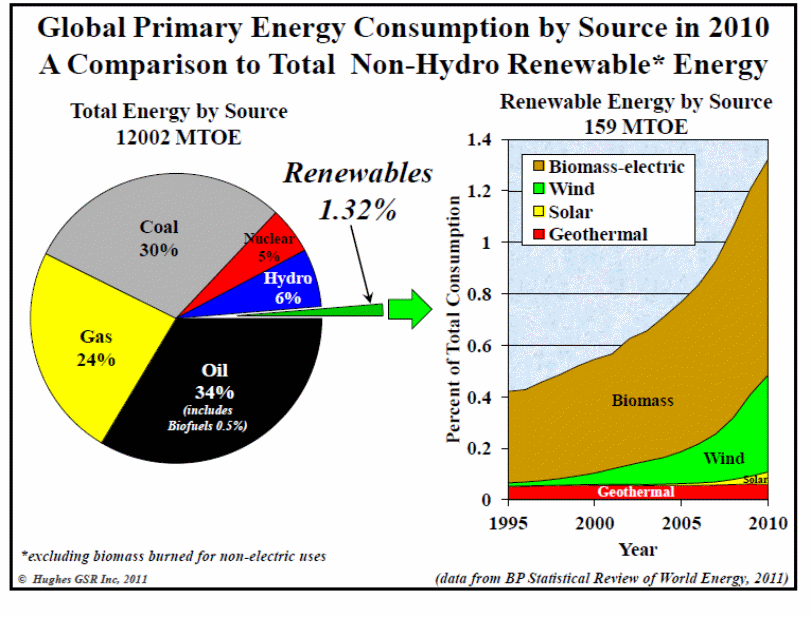
The uptake, development, and use of renewable energy in the past decades have been slow partly because of cost and expensive technology (International Energy Outlook 2013 2013). A comparison between renewable energy consumption by source in 2010 and non-hydro-renewable energy shows an increase of 1.3% and 6% for hydro sources and the rest, 82.7% fossil fuels (Dincer 2000).
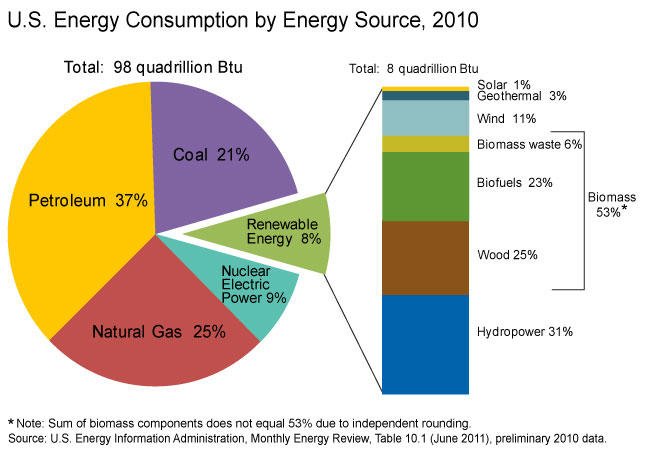
Current Renewable energy consumption
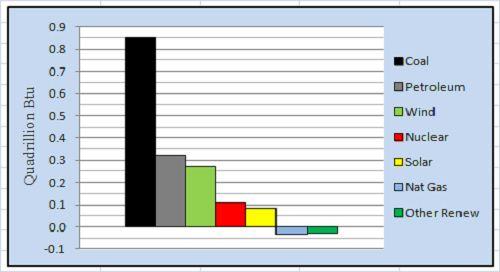
The graph below shows the current energy consumption in the US in terms of quadrillion Btu’s (Duncan 2001).
In comparison with the past, there is an increase in the consumption of renewable energy, which accounts for 42% of the global energy, showing a positive trend in energy consumption (Yearbook 2013: Global Energy Market Review
2013). The reasons for the increase has been the low cost of alternative sources, adverse effects of global warming, with current models showing an combined increase in global warming. Job creation for many people, operational efficiency of renewable energy producing capabilities, energy price stability which has been caused by recent fluctuations in the prices of oil, gas, and electricity because of political events, market deregulations, and the global economic crisis significantly contribute to the shift in the consumption of renewable energy and away from the use of fossil fuels (Dincer 2000).
Energy Consumption Per Capita
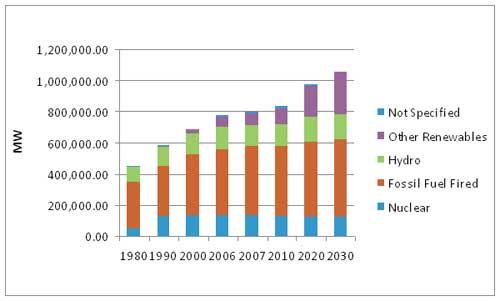
Nuclear development
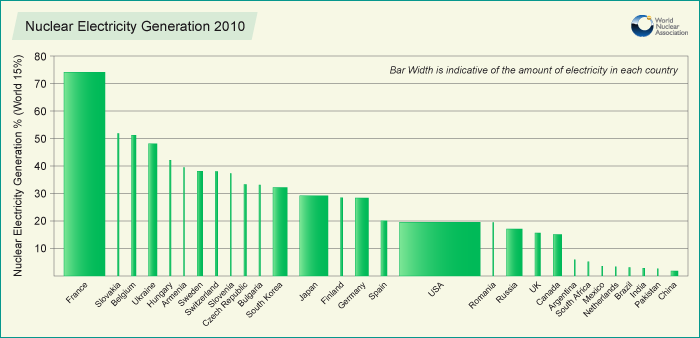
The current status of nuclear energy was the result of 50 years of development, which by 1970 had reached 15 power stations producing 16, 500 MWe, with 30 new nuclear units built per year, which increased rapidly after the oil boom of 1970 (Glaser 1968). By 2000, North America was producing 131 GWE of energy, which is 12of the total energy produced, Europe 12% equivalent 148GWE, and Asia producing 5.4 % GWe. The rapid development of nuclear contributes 6% to global primary sources of energy. There has been a successive development of nuclear powered electricity generating plants in 32 countries and the number is rising. China produces 58 GWe of electricity, with 30 new reactors under construction, India produces 14.5 GWe, Russia produces 30.5 GWe, Europe produces 1650 GWe, and the United Sates produces as shown below (Gross, Leach & Bauen 2003).
Ratio of renewable and non-renewable energy consumption of recent year in world
The ratio of renewable and non-renewable energy is shown on the graph below.
Ratio of renewable and non-renewable energy consumption
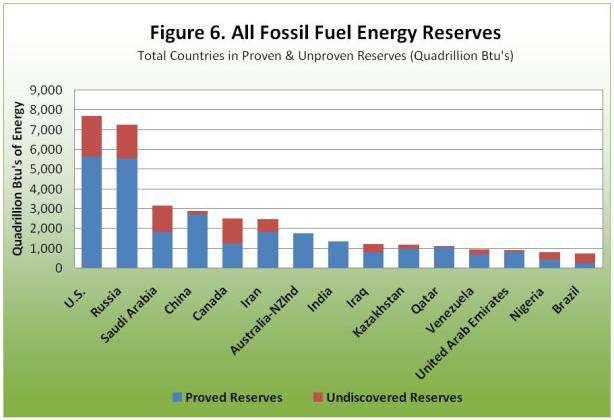
Current Fossil fuel energy supply
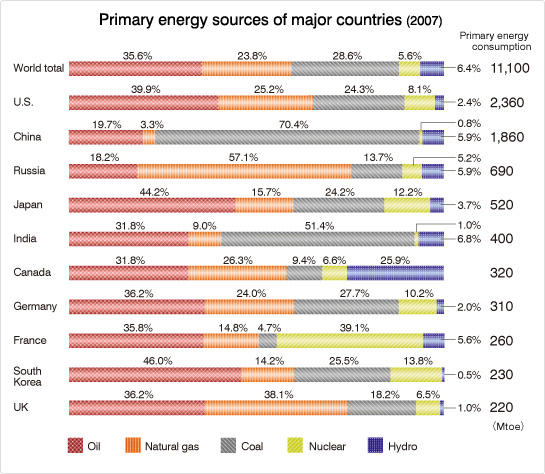
The United States has 17.2% of the world’s supply of fossil fuels equivalent to 5, 619quadrillion Btu, Russia has 16% of the global supplies equivalent to 5,535 quadrillion Btu, and other countries are shown in the table below.
Optimal global fossil fuel energy supply
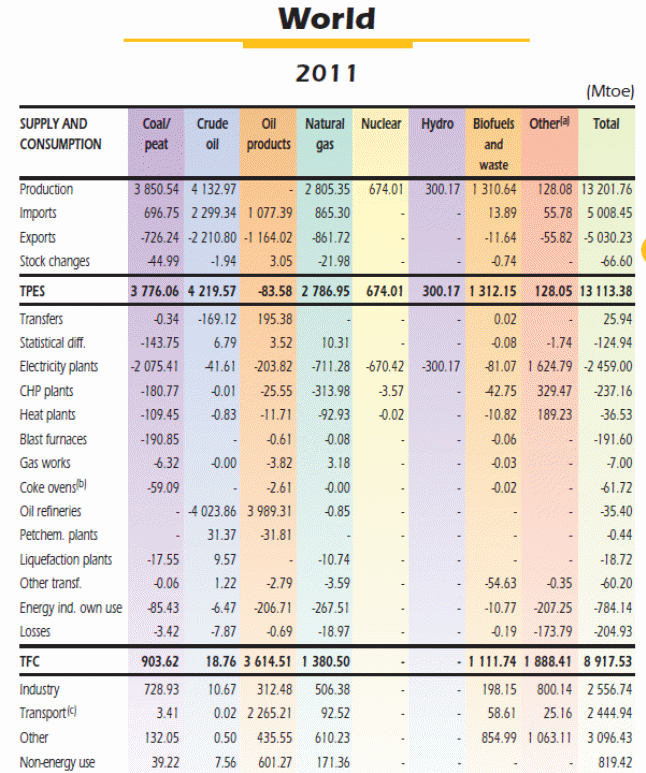
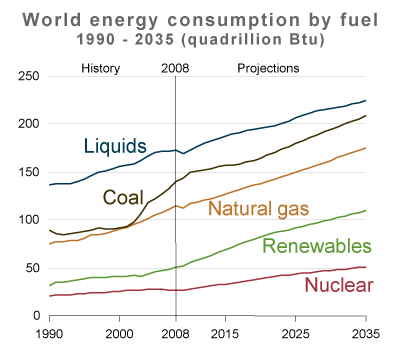
World energy consumption
According to Hohmeyer (1988 p.2), the global energy consumption by 2011 is shown in the graph below.
The graph below shows the current world energy consumption and future estimates.
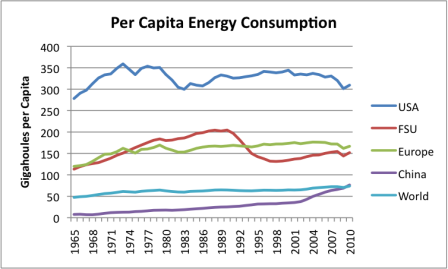
Energy Consumption Per Capita By Now
The energy per capital consumption is shown in the graph below
Forecast of world energy consumption in the next 20 years

References
Asif, M & Muneer, T 2007, ‘Energy supply, its demand and security issues for developed and emerging economies’, Renewable and Sustainable Energy Reviews, vol. 11, no. 7, pp. 1388-1413. Web.
Boyle, G 2004, Renewable energy. Oxford University Press, New York. Web.
Cooke, W F & Wilson, JJ 1996, ‘A global black carbon aerosol model’ Journal of Geophysical Research: Atmospheres’, vol. 101, no. D14, pp. 19395-19409. Web.
Eaves, S & Eaves, J 2004, ‘A Cost Comparison of Fuel-Cell and Battery Electric Vehicles’, Journal of Power Sources, vol. 130, no. 208, pp.234. Web.
Demirbas, A 2007, ‘Progress and recent trends in biofuels’, Progress in energy and combustion science, vol. 33, no.1, pp., 1-18. Web.
Dincer, I 2000 ‘Renewable energy and sustainable development: a crucial review’, Renewable and Sustainable Energy Reviews, vol. 4, no. 2, pp. 157-175. Web.
Duncan, RC 2001, ‘World Energy Production, Population Growth, and the Road to the Olduvai Gorge’, Population and Environment, vol. 22, no.5, pp. 349. Web.
Glaser, PE 1968, ‘Power from the sun Its future’, Science, vol. 162, no. 3856, pp. 857-861. Web.
Gross, R, Leach, M & Bauen, A 2003, ‘Progress in renewable energy’, Environment International, vol. 29, no. 1, pp.105-122. Web.
Hohmeyer, O 1988, Social costs of energy consumption. Springer, New York. Web.
Kruger, P 2006, Alternative energy resources: the quest for sustainable energy. John Wiley. Web.
International Energy Outlook 2013. Web.
Laidler, JJ, Battles, J E, Miller, W E, Ackerman, JP & Carls, E L 1997, ‘Development of pyroprocessing technology’ Progress in Nuclear Energy, vol. 31, no. 1, pp. 131-140. Web.
Lefohn, AS, Husar, JD & Husar, RB, 1999, ‘Estimating historical anthropogenic global sulfur emission patterns for the period 1850–1990’ Atmospheric Environment, vol. 33, no. 21, pp. 3435-3444. Web.
Marland, GA.A B, Boden, TA., Andres, RJ.,Brenkert, A L.& Johnston, C A. 2003, Global, regional, and national fossil fuel CO2 emissions. Trends: A compendium of data on global change, vol. 2, no. 2, pp.34-43. Web.
Menyah, K & Wolde-Rufael, Y 2010, ‘CO< sub> 2 emissions, nuclear energy, renewable energy and economic growth in the US’, Energy Policy, vol. 38, no. 6), pp. 2911-2915. Web.
Nordhaus, WD & Yohe, GW 1983, ‘Future carbon dioxide emissions from fossil fuels’ Changing Climate, vol. 1, no. 1, pp. 87-153. Web.
Ramírez, C A & Worrell, E 2006, Feeding fossil fuels to the soil: An analysis of energy embedded and technological learning in the fertilizer industry. Resources, Conservation and Recycling, vol. 46, no. 1, pp. 75-93. Web.
Shafiee, S & Topal, E 2009, ‘when will fossil fuel reserves be diminished?’ Energy Policy, vol. 37, no. 1, pp. 181-189. Web.
Turner, JA 1999, ‘A realizable renewable energy future’, Science, vol. 285, no. 5428, pp. 687-689. Web.