Abstract
Music festivals work as powerful mediums for inspiring, motivating and stirring transformation for an improved world. These can be observed as a common platform for gathering, making relationships with other people and celebrating with others. Music festivals open people’s hearts, fuel joy and provide opportunities for actuality and being in the right place. Hence, music festivals are important in the way that they add to the conversion of sustainability. The prime objective of most of the festivals is to fulfil the specific needs of a community and provide entertainment. Students’ choices for travel and leisure destinations are followed by a wide array of motivations. These festivals provide them opportunity to interact with their friends and fellow students and share their experiences with them.
Music festivals are very popular among the Chinese students and China’s music festival industry has enormous potential. However, the growing competition in this sector has made it necessary to understand the relationship between the motivation and satisfaction of the visitors with the music festivals. The present research is an attempt to understand and analyse the relationship between Chinese university students’ motivations for attending the popular Strawberry Music Festival in China and the satisfaction gained from their experiences.
It is found in the survey that experimentation, recreation, family togetherness and socialization are the more common factors that are observed to be motivating the Chinese students for coming to the music festival and festival image, destination image, experience opportunities; cost and trip quality is positively related to their satisfaction. The research may help the music festival organizers to understand what motivates the Chinese students to participate in the music festivals and how to provide them the utmost satisfaction with the music festivals.
Introduction
Festivals and celebrations have been a part of recreational program from ancient times. During ancient period, these festivals and celebrations were mainly in the form of leisure activities with religious essence (Celik & Cetinkaya 2013).
People involved in different religious and cultural activities celebrating mainly the agriculture harvesting for getting retreat and break from their mundane work routines. Later, the transformation of rural labour into urban labour generated different groups in the society that demanded leisure as a necessity. Main factors contributing to the growth in leisure activities were: technological advancements, growth in the average age, improved revenues and significance of time. According to Karakucuk (1997), “The recreational activities that are done voluntarily on personal choice with an aim of protecting human body which is seriously affected by the intensive work of human being, routine life style or negative environment effects, regaining, protecting and keeping the mental health and getting pleasure providing personal enjoyment in the leisure time are defined as events” (as cited in Celik &Cetinkaya 2013, p.2-3). Events are an integral part of the tourism development plans and play an important role in the destination desirability (Getz, cited in Celik &Cetinkaya 2013).
Events are organized with an aim to meet the social or individual needs arising as a result of humanity’s acting together. These are aimed at achieving the common goals as a group or organization in some certain situations instead of individual way. Besides this, these are structured with a purpose to share a common idea and to be a social being in social life (Poloma, cited in Celik & Cetinkaya 2013).
Cohen and Taylor (1976, p.49) assert that “holidays are culturally sanctioned escapes routes for inhabitants of western world.”
Getz categorizes events mainly into three sections.
- The first type of events includes cultural celebrations, events related to art and entertainment and political events.
- In the second group, commercial, educational and scientific events are included.
- The third group consists of the special events, sports and recreational happenings (as cited in Popescu & Carbos 2012, p.19).
A significant part of all events are the festivals that provide diverse and unique experiences to the visitors and take them away, for some time, from their regular mundane life and entertainment media. It can be experienced in different forms of celebrations such as dance, drama, ethnic and cultural heritage music, comedy and religious ceremonies etc. The festivals are organized with an aim to provide recreation, protect and develop the local cultural heritage and develop local tourism industry and employment opportunities (Gunersel, cited in Celik & Cetinkaya 2013). Their distinctiveness is evident from their emphasis on society and celebration and theme arising from their own society (Buther, cited in Celik & Cetinkaya 2013). Events are unique because they are available for a specific period of time (Small 2007).
It is evident through research that involvement in a particular activity can predict the participant’s intentions about its continuance in future (Kouthouris 2009).
The prime objective of most of the festivals is to fulfil the specific needs of a community and provide entertainment. They provide a feeling of social and cultural belonging to the community people. Besides this, people sharing same festivals also develop a sense of geographical belonging (Popescu & Carbos 2012).
Music is integrated and fused in several types of festivals, thus, the festival having music as an organizing theme becomes a music festival. According to Bowen and Daniels (2005), “Music festivals organized around live music performances are unique special events that can attract visitors from an expansive breadth of demographics” (as cited in Mosley, Lehto & Day n. d., p.1).
In comparison to the other festival activities, the musical ones are more popular and attract the visitors definitely (Chung 2014).
Music festivals work as powerful mediums for inspiring, motivating and stirring transformation for an improved world. These can be observed as a common platform for gathering, making relationships with other people and celebrating with others. Music festivals open people’s hearts, fuel joy and provide opportunities for actuality and being in the right place. Hence, music festivals are important in the way that they add to the conversion of sustainability (Stettler 2011).
One of the most intriguing aspects of music is its apparent ability to evoke emotions in listeners. However, it is difficult to examine under what situations they experience emotions to music (Juslin et al. 2008).
Popularity of music festivals is widespread and attendance in such events continues to increase in many countries including the United States and European countries (Snell 2005).
Youth tourism is an increasing phenomenon in the global tourism market. Their motivations and expectations from the events and festivals provide a significant basis for future event organising. Youth and student travel has served as a significant keystone in the past 50 years, but there was not much light thrown into this field. However, in the recent years, the explosive growth of the international youth market has brought the subject into spotlight. “The importance of youth tourism as a field of interest for policy makers was first emphasised internationally in November 1991 with the first World Tourism Organisation (WTO) conference on youth tourism in Delhi” (Richards & Wilson 2003, p.6).
International organizations like the International Student Travel Confederation (ISTC) and Federation of the International Youth Travel Organisations (FIYTO) are established to look after the tourism related needs of a large number of youth travelling internationally (Richards & Wilson 2003).Analysis of youth travellers suggests that “they involve in wide range of activities during their stay, which underlines the desire to seek various experiences” (Moisa 2010, p.645).
Statistics to the research topic
Increasing number of festivals in the United States has raised a fierce competition among the event organizers for attracting more and more visitors and talents. People are spending a lot of money and time on these events (Kitterlin & Yoo 2014).
These festivals are rising in popularity with increased number of attendees every year. In Australia, in the last five years attendance in the famous live music festivals has increased by 40% to 47%. According to the Australian Council for Arts (2010), the Australian youth was found to be more motivated by the musical events as compared to the rest of the population. However, employed youth attended music events more (76%) than the students at secondary students (59%) and tertiary students (69%). The reason behind employed youth’s higher attendance could be their higher disposable income than the students. The young group seems to be motivated by the arts in its creative as well as receptive form (More than bums on seat: Australian participation in the arts 2010).
“In September 2012, 269, 672 people had signed up to the official Big Day Out Facebook site, whereas the number of people signing up to the official Wallabies (national rugby site) Facebook site was only 173,210. This is suggestive of the fact that music festivals are becoming more popular with the young population and challenges the widespread perception that young citizens or students are more inclined towards sports than arts” (Ballantyne, Ballantyne & Packer 2014, p.1).
Popularity of music festivals can be understood by the fact that tickets of the famous music festivals like the Glastonbury Festival in the UK are sold out immediately after their release. The sites selling these tickets had a difficult time while selling 3000 tickets per minute for the Glastonbury Festival2014 (Glastonbury 2014 tickets sell out in record time 2013).
It is evident through research that events are the driving factors for increased tourism (Getz et al, cited in Mosley et al. n.d.). International and domestic leisure and travel activities provide a significant market to the tourism industry. Different people have different motivations for travelling and that makes it complicated for the marketers to monitor (Smith 2010).
The fast growing economic changes and the increased use of electronic and social media by the students has significant influence on their travelling decisions (Scott-Halsell & Saiprasert 2011).
Students’ choices for travel and leisure destinations are followed by a wide array of motivations. “Both internal and external motivations ultimately influence where, when, and how students travel” (Smith 2010, p.3) Besides the activities like visiting the famous tourist spots and cultural objectives, the youth indulges in various other activities like visiting the less popular tourist areas, relaxing on the sea side, getting close to the nature, taking part in different events and festivals, going to see friends and relations etc. (Moisa 2010). College students are included in the youth group. They live in the present, are keen on experimentation, and are eyeing on instant outcomes (Lee 2002).
One among the four ancient civilizations, China, has a vast geographic stretch and a history of almost 3,600 years. China is proud of its rich and intense culture that can be found back many centuries ago (Chinese Culture 1998).
Music festivals are very popular among the Chinese students. These festivals provide them opportunity to interact with their friends and fellow students and share their experiences with them. They get an opportunity to share their feelings such as sadness, joy, disappointment, excitement through music as it is the best medium for expressing one’s feelings and thoughts (Frisch 2010).
Like the other big businesses of the country, China’s music festival industry too has: “huge potential, eye popping expansion, rampant imitation and meddlesome government officials. There is also a great quantity of glittering, impressive output of dubious quality, longevity and profitability” (Frisch 2010, par.1).
“In China, the Woodstock- like idealism that was strongly associated with Cui Jian’s first generation of rockers- was in its initial stages in 1989, when the Chinese urban youth was pushed strongly away from ideas and towards consumerism” (Frisch 2010, par.1). In absence of any values musical festivals are treated by Chinese youth as a medium to show-off their fashion sense and having a get together with their friends. However, the new emerging concepts about music festivals in China ensure transformation and evolution of music festivals leading to their increasing demand among the Chinese youth. Music festivals are becoming very popular especially among the Chinese students.
These festivals provide them opportunity to interact with their friends and fellow students and share their experiences with them. They get an opportunity to share their feelings such as sadness, joy, disappointment, excitement through music as it is the best medium for expressing one’s feelings and thoughts (Frisch 2010). Companies like ZMF (Zebra Music Festival) plan to organize annual festivals in numerous cities and ensure that the events and programs are planned as per the taste of the people living in the area. For example, they focused on rock music while planning the event for Chengdu in 2009 and pop music for the Hangzhou in 2010 where people prefer pop music (Frisch 2010). According to Scarlett Li (a music executive atop Zebra media), “We try to offer an experience that is tailor-made to the tastes of each city” (Frisch 2010, par.8).
Why you are going to choose this research topic
Music festivals are an integral part of Chinese society, therefore, they always demand significant amount of exploration in order to understand the factors responsible for their success and popularity among the visitors. With the evolution and growth in the number of music festivals with the theme of modernity, there has evolved a great connection between these festivals and university students as they constitute the major part of the visitors. The increased number of festivals has led to severe competition among the festivals with respect to the number of visitors attending them. The growing competition has made it necessary to understand the relationship between the motivation and satisfaction of the visitors with the festivals (Boer et al. n.d.).
Knowledge about the motivational factors that drive the Chinese university students to attend these festivals can help in increasing the level of satisfaction among the students by providing them better experiences. Moreover, these insights also help the organizers to familiarize with the demands of anticipated viewers.
Aims and objectives
The research aims to analyse the relationship between Chinese students’ motivations for attending the music festival and the level of satisfaction gained from their experiences.
The research attempts to seek the following objectives:
- To determine the motivation factors on Chinese university students’ participation in music festivals.
- To determine the satisfaction factors on Chinese university students’ participation in music festivals.
- To find out relationship between motivation and satisfaction of Chinese university students’ participation in music festivals.
- To suggest the organizers of music festivals on attractive factors for increasing the participation in music festivals among Chinese university students.
Structure of this dissertation
This dissertation is completed in four parts. The first chapter is the literature review that provides in depth information about the subject of research through a comprehensive study of scholars’ works. It helps in gaining insights about events and festivals, the motivational factors for attending festivals and the factors influencing their satisfaction with the festivals. Different theories developed on the subject of motivation, satisfaction and their mutual relationship with reference to events and festivals have been discussed. A review of different case studies conducted on the subject has been presented in the chapter.
Based on the review of the literature, a research model has been developed for the present study to analyse relation between factors such as the festival image, destination image, experience opportunity, cost, trip quality and festival quality and visitors’ experiences and satisfaction levels with a particular festival.
The second part of the research deals with research methodology employed in conducting the study. It, therefore, covers primary research, quantitative analysis, its advantages and disadvantages, questionnaire design, data collection and ethical considerations. The locale and data collection method are also discussed. A 5 point Likert scale is used to measure the hypotheses of the research questions. The methodology included techniques of determining the quantity and consistency of results.
The third part presents the key findings of the survey along with their step by step analysis. In order to check the mean value, standardized deviation, and normality of statements, the descriptive statistics analysis is conducted. The Cronbach’s Alpha is used to measure the reliability in SPSS relating to the present study. The correlation between the motivational factors and the satisfaction factors is checked by creating a scatter plot. A multiple regression linear is used to see how and to what extent these variables influence customer satisfaction.
The fourth and the last part presents the conclusions inferred from the study. It provides a comprehensive analysis of the main findings taking up all the objectives of the research one by one and then finding the answer to the overall aim of the research work. This part of the dissertation also describes the usefulness of the study for visitors and organizers. Moreover, it recommends some ideas for festival organizers and event managers that may help in improving the image of their offerings to improve and augment satisfaction levels among the visitors.
Literature Review
Concepts—general case study
It has been recognised through researches that music is a powerful medium to “exault the human spirit, transform the human experience, bring joy, beauty, and satisfaction to people’s lives” (Pascoe et al. 2005, p.8).
Music festivals open more opportunities for students to explore as they allow an opportunity to discover different places and destinations which they might not have thought of visiting (Mosley et al. n. d.). “Much of the available literature examining people’s motivations for engaging in music related activities and events focuses on the development and reinforcement of the individual and/or community identity” (Ballantyne et al. 2011, p.1).
Packer & Ballantyne (2011) studied the psychological impact of the music festivals on young adults and found that the music festivals provide a common ground for gaining the experience of socialising with others which is not possible while listening to recorded music or being present in a concert. They found that visitors develop a sense of connection with other visitors as well as with the performers.
More opportunities for exploration are offered through music festivals to students as they allow an opportunity to discover different places and destinations which they might not have thought of visiting (Mosley et al. n.d.).
The power of engaging in music is evident in everyday life. In their study of students aged between 20-31 years, Juslin et al. (2008) found that the feelings of happiness, elation, and nostalgia were more common experiences with the music festival attendees.
ISTC’s with the Association of Leisure and Tourism Education (ATLAS) conducted a transitional survey in 2002 to gain insight into the subject of youth and student travel market. The survey revealed that exploration and excitement were the most common motives among the student travellers. Improving knowledge, relaxation and socialization were the other important driving factors motivating the students to visit new places and events. The survey brought into light the eagerness of students below the age of 26 for developing friendly relations with others and their excitement and opportunity to experiment (Richards & Wilson 2003).
Theories for the research area
Music theorists emphasize on the need to take active participation in music for creating identity through “self-expression, mood enhancement, and spiritual expressions” (Juslin & Sloboda 2001, p.337).
Packer & Ballantyne (2011) found in their research that music festivals are significantly related to social wellbeing and psychological benefits. They reported that music festivals provide a unique sense of engagement and connection that is not possible in some other form of musical events such as the music concerts. Music festivals allow greater interaction with other attendees and the artists.
Research on the subject of travel motives has helped in gaining insight into the factor that influences the travelling decisions of people. According to Getz and Cheyne (2002), there are three dimensions of motives to attend events:
- Firstly, individuals are motivated to special events by common leisure and travel motives. These include the related theories of seeking escape and needs fulfilment.
- Secondly, individuals are interested in specific features of certain events. These are related to the distinctiveness of events and aimed benefits related to the subject and program.
- Finally, people are driven by extrinsic aspects that are separate from any particularity of the event (as cited in Abreu-Novais & Arcodia 2013, p.36).
Age and education has a significant influence on influencing travellers’ choices or motives for travelling (Cha, Mccleary & Uysal 1995).
There are many entertainment options available to the consumers from individual festivals and host communities; hence, festival organizers need to focus on enhancing and maintaining the intrinsic motivations of festival attendees.
In order to understand the relationship between motivational factors for participating in music festivals among students and the satisfaction factors with respect to the motivations and to analyse the relationship between these two phenomena, we need to look at the theories of motivation and satisfaction.
Motivation
Motivation is a phenomenon that is closely related to the basic of human behaviour. It provides understanding, explanation and prediction and hence, is the focal point in any social scientific study (Jafari 2003).
The socio psychological definition of motivation is generally seen in the context of emotional and cognitive motives (Ajzen & Fishbein n.d.).
It is normally known that the intensity of motivation can be judged by a person’s involvement and preoccupation in an interesting activity that makes him is neglectful to all else. Intrinsic motivation (Deci 1975), or motivational flow (Csikszentmihalyi 1975) are situations where conditions are created that enhance interest in seeking mastery and learning (as cited in Graham &Weiner n.d. p. 63).
The organizers of the International Bellapais Music Festival, that is organised every year in North Cyprus between May and June, feel that the common motive to attend the festival is driven by the desire to be together with their family and upkeep the festival. Their previous experiences with the festival and the reputation of the festival are also a driving force to attend the festival (Dikmen & Bozdaglar 2013)
Some other common principles of motivation are based on the argument that performance or learning is affected in the situations where motivations for basic necessities like food and living are more persistent (Maslow cited in Graham &Weiner n.d., p. 63). It is argued that motivation in the form of positive benefits subsequent to certain behaviour increases the chances of its repetition. It is also believed that students are more motivated for acquiring mastery of the material rather than competing with others. Establishing contextual relationship between students and their performance is necessary for increased motivation as a performer rather than a passive recipient (Skinner, Nicholls & deCharms, as cited in Graham &Weiner n.d., p. 63). Besides this, it is also important to recognize and prioritize motives in understanding the factors that have influence on the decision making processes of the visitors (Crompton & McKay 1997).
Crompton’s (1979) concept of seven socio-psychological motives provides significant insight into people’s decisions for attending the music festivals.
Crompton believes the following motives drive people to visit new places and events:
Escaping the mundane environment
People need to change their environment for some time to avoid the boredom of daily routine life in order to seek pleasure in the environment that is different than that in which they normally live.
Self Evaluation
According to Crompton, exposure to a different new situation provides opportunity for self-discovery. People get motivated to visit different places because it offers them a whole new experience different from the one they get in the familiar surroundings.
Relaxation
Another motive of attending the festivals or events is that it provides mental relaxation to the attendees. According to Crompton, relaxation here means spending time in following the activities of interest. People visit places or events to seek pleasure and mental peace; however, it may result in physical exhaustion.
Prestige
The desire to stand high in the eyes of others drives people to do something different. Visiting different places and attending unique events is considered a prestigious activity and influences visitors’ decisions about their leisure planning.
Regression
People seek pleasure vacation in order to have a chance to do activities which they cannot pursue in their routine life styles. An urge to engage in irrational and childish behaviour sometimes motivates people to visit newer places or attend festivals that offer them opportunities to withdraw from their usual roles and obligations. The desire to regress from the complex, changeable and technologically advanced environment drives people to visit different and unique destinations and events.
Family Togetherness
Family togetherness is also a motivational factor for visiting the festivals as it enables family members to spend time in one another’s company. It enables to have a greater understanding of each other that is generally not possible in a usual set environment.
Socialization
Meeting new people in different settings is a significant motivational drive for people to visit different places or events. The short time meetings with unfamiliar people or groups provide opportunities to exchange views and extend social contacts (Crompton 1979).
Crompton and McKay (1997) enunciated ins and outs of conducting festival and event motivation studies with the belief that it will help in increasing the satisfaction level of the visitors with the festivals. They suggested that awareness about festival motivation will help in designing appropriate offerings for visitors, in recognizing the factors influencing their decisions and eventually increasing their satisfaction levels with the events. People involve in certain products or services in order to satisfy their needs, hence festivals should be designed keeping in view the expectations of the visitors from the particular event. Festival elements may suffer from suboptimal presentation in case of inadequate awareness about visitors’ needs (Crompton & McKay 1997).
Crompton and McKay (1997) studied the relevance of the seven motive domains in context of the 10 days festival including various non-sporting events organised by Fiesta San Antonio and inferred that people may have different motives for any kind of event and different events can satisfy the similar needs to different degree. It is possible that the same event type is capable of satisfying different needs. It found that festival visitations are more influenced by recreational motives in comparison to tourism offerings (Crompton & McKay 1997).
Push factors and Pull Factors
Dann (1997) presented the theory of push and pull factors that affect tourists’ motivation for travelling (as cited in Thaothampitak &Weerakit 2008, p.2).
The idea of push and pull model is to disintegrate the destination choices into two forces. The first type of force pushes people to go somewhere else but does not specify the destination. However, the pull force attracts visitors to some specific destination. Push factors is a phenomenon relating to the socio psychological constructs and environments of the visitors that explains the driving factor behind the desire to travel. “Most of the push factors are intrinsic motivators such as, the desire for escape, rest and relaxation, prestige health and fitness, adventure and social interaction” (McGhee, Murphy & Uysal1996, p.46).
Gnoth (1997) explains that push factors are internally produced drives that force people to explore signs in objects and events that ensure lessening in the dominant drives. On the other hand, pull factors are created by the visitors’ familiarity with the goal. Push factors may lead to different responses to diverse external situations (Pavlov, cited in Gnoth 1997).
Whereas pull factors are based on cognitively accessible considerations (Psylyshyn, cited in Gnoth 1997).
The study of Mohammad & Som (2010) also supports the idea that tourists are motivated by internal and external factors. They discovered that people go on vacation to fulfil their intrinsic desires and their decisions are influenced by the destination characteristics (Mohammad & Som 2010).
Kanagaraj & Bindu (2013) found in their study of push and pull travel motivation of domestic tourists to Kerala, India that “tourists are motivated to go away from rather than go towards something” They believe that people decide to go on vacation driven by two most significant psychological motives: relaxation and escape motives.
Xu, Yoder & Matarrita-Cascante (n.d.) incorporated both push and pull factors in studying the university students’ travel motivations for spring break vacations. Their survey revealed that there were four dominant motivational factors that pushed the students to travel. These factors included: exploration, relaxation, activity seeking and socializing. Out of these four push factors exploration and relaxation were the most dominant motives leading to the inference that university “students travel mainly to pursue rest, excitement, thrill, and difference” (Xu et al. n.d., p.2-3).
However, the desire to observe and participate in different lifestyles and cultures was also observed among some students. They got an opportunity to learn and experience something different that was not possible in their routine lifestyle. Activity seeking and socializing indicated students’ urge for recharging and experiencing independence.
Besides the above mentioned push factors, there were certain pull factors such as “entertainment, facilities and services and environment” (Xu et al. n.d., p.3). Entertainment was the most dominant factor in driving students to visit particular places and events. It was inferred from the responses of the students that people rely on the information gathered from family and friends for planning their short term vacations regarding the recreational activities, decent travelling environment along with favourable amenities and services.
The study of Xu et al. (n. d.) provides a more comprehensive picture of travelling motivations by measuring both push and pull factors. The findings of the study help in gaining insight into the travelling motivations of university students and consequently developing effective strategies to ensure them greater travelling satisfaction.
“Based on the intrinsic and extrinsic motivations, individual tourist builds his or her perceptions, and the perceptions can be different from the true attributes of the product depending on how the individual receives and processes information” (Gartner et al. cited in Mohammad & Som 2010, p. 42).
Satisfaction
The success of events and their image as successful destination depends on visitors’ satisfaction with the offerings. Visitors’ satisfaction influences their decisions to revisit the destination (Kozak & Rimmington 2000).
Satisfaction relates to the post-purchase evaluation of the overall service experience. According to Fournier and Mick (1999, p.16), “Satisfaction is a context-dependent process consisting of a multi-model, multi-modal blend of motivations, cognitions, emotions, and meanings, embedded in socio-cultural settings, that transforms during progressive and regressive consumer product interactions.”
Satisfaction relates to consumers’ opinion about a product or service (Oliver 2010).
Therefore, it is a significant strategic element that requires appropriate consideration in marketing (Baez-Montenegro & Devesa-Fernandez 2014).
Mayo and Jarvis (2008), describe that the consistency theory makes people like things to take place as per their desires and complexity theory describes that surprising and unique things make people satisfied (as cited in Yu &Yen 2012, p.214).
Satisfaction in travelling and tourism is normally used as an assessment device that examines the efficacy of the experiences observed at the events or destinations. Satisfaction is a tourists’ emotional state after experiencing the trip (Baker & Crompton 2000).
Studies show that motivation for different festival products may vary among different festival attendees, however, the socio-economic impact and satisfaction is found mostly same with all the visitors irrespective of the difference in the festival products (Yolal, Woo & Centinel 2012).
Destination image implements an affirmative influence on supposed value and satisfaction. Chi & Qu (2007) state, visitors’ satisfaction improves with the positive image of the destination. Further, more favourable image increases the possibility of revisit to the same destination.
Relationship between motivation and satisfaction
Motivation for a certain act or behaviour should fulfil in its satisfaction. It is closely related to satisfaction. People need to have motivation before experiencing the events and their experiences need to be followed by their satisfaction with the event. Usually, festivals pull visitors from local areas and their sustainability depends largely upon increasing number of repeat visitors. The increasing number of festivals has made it necessary that the experiences of visitors should ensure their revisit to the festivals “If needs are fulfilled, then satisfaction will result. Therefore, in order to monitor satisfaction, there should be knowledge of needs which festival visitors are seeking to satisfy” (Crompton & McKay 1997, p.426).
According to Dann (1981), “It makes little sense to study satisfaction in isolation from motivation” (as cited in Crompton & McKay 1997, p.426). Beerli &Martin (2004) assert that motivation is “the need that drives an individual to act in a certain way to achieve the desired satisfaction” (as cited in Thaothampitak &Weerakit 2008, p.2). Motivation needs to explain the satisfaction of the underlying cognitive and emotional motives of certain behaviours. Motives can be of two types: internal (psychological) and external (situational) in terms of tourist motivation (Gnoth 1997).
According to Iso-Ahola (1982), “Individuals perceive a leisure activity as a potential satisfaction-producer for two major reasons: it provides certain intrinsic rewards, such as feeling of mastery and competence (approaches), and helps them leave the routine environment behind (avoidance)” (Iso-Ahola1982, p. 259).
Any leisure activity is seen as a potential satisfaction provider by people because it offers some intrinsic rewards like tones of mastery and capability and allows them to come out of their routine environment. Generally, both the components are present in the leisure motivation and specifically in tourism motivation though their significance vary for different groups or individuals (Iso-Ahola 1982).
According to Leiper (2004) motivations can be seen “as a force for people to act to satisfy their needs; when individuals feel a state of deprivation, there is a need for them to satisfy the shortage”(as cited in Yu &Yen 2012, p.214).
“Motivation serves as a mechanism to initiate, direct, and arouse human behaviours and it is an appropriate lens through which to examine how behaviours are generated” (as cited in Yu &Yen 2012, p.214). Pitts (2005) studied the visitors’ experiences at the Round chamber music festival in Sheffield and found that audience did influence one another in the festival and has a significant connection with the performer.
There can be different motivation types that drive people to remain engaged in some particular leisure event and have positive experience that eventually leads to satisfaction (Geus, Richards & Toepoel 2013).
These studies support the notion that music festivals satisfy the need of social integration among visitors that motivates them to visit the festivals. Richards and Wilson (2003) discovered that the satisfaction level of the participants in the music festivals motivates them to repeat their experience. Music is a medium for young people to communicate and express their individual identities which allows them to present themselves in a particular way, share their values and exhibit their attitudes” (as cited in Hargreaves, Miell & Macdonald 2002).
Festival attendees can be put in two categories: First category consists of the people who have attended the festival for the first time and second category comprises those visitors who have already experienced the festival and are familiar and satisfied with the event. Both the groups are significant with respect to their socio-demographics, attitudes, destination awareness and travel motivations. It is found that repeat visitors are more satisfied than the first time visitors and spends more and stay for longer as an authentication for their loyalty (Kruger, Saayman & Ellis 2010).
Young people consider music as a ‘badge of identity’ (North & Hargreaves 1999). They feel that engaging in some particular kind of music can help in forming and expressing their identity (Goulding, Shankar & Elliot 2011).
Research gap
Festivals draw the attention of most scholars due to their universality and popularity in terms of visitors’ experiences and occupy a significant place in cultures all around the world. Hence, sociologists and anthropologists find great interest in studying the subject and developing relative theories. Festival studies have also proved appealing for the students and event organizers as these are associated with creativity, crowd pulling and generating emotional reactions (Getz 2010).
The value and worth of music festivals to society and culture have been addressed in several researches, but there has been little research on the correlation of visitors’ motivations and satisfaction with respect to these festivals. Despite holding a significant place in the event related literature, festivals were not considered separate and independent category of events (Getz 2010).
The research done in this field is mainly associated with the economic impacts and visitors’ motivation. It is important for the festival organizers to understand the relationship between the motivational factors and the satisfaction factors of visitors’ participation in the music festivals and to gain insights about their event experiences so that significant perceptions can be developed for better planning and improvement in future (Boer et al n.d.).Therefore, this research work is an attempt to gain deeper insight into the motivations of university students for participating in a particular music festival and their experiences related to the satisfaction of these motives, using Chinese university students’ as the sample of study.
Conception model
Based on the review of the literature on the research area, a research model has been developed for the present study that includes motivational factors such as the festival image, destination image, experience opportunity, cost, trip quality and festival quality to assess visitors’ experiences and satisfaction levels with a particular festival.
Hypotheses
In view of the literature reviewed for the purpose of the study, some hypotheses have been generated that require to be tested through survey on the research area. These are:
- H1: festival image is positively related to satisfaction.
- H2: destination image is positively related to satisfaction.
- H3: experience opportunities is positively related to satisfaction.
- H4: cost is positively related to satisfaction.
- H5: trip quality is positively related to satisfaction.
- H6: festival quality is positively related to satisfaction.
Case Study
This paper focuses on the Chinese students’ motivation for visiting the Strawberry Music Festival in China and their satisfaction with respect to their motivations for participating in the event. Organized by the key indie music company in China, Modern Sky Entertainment, the festival was earlier known with the name of Modern Sky (Shwartz 2015).
Founded in 2009, Strawberry Music Festival is an entertaining music experience for the youngsters every spring. It attracts the maximum number of spectators in China. This popular music festival has evolved tremendously with the visitors’ number ranging from 10,000 in the first year of its inception (2009) to 50 thousand in 2013 (2014 Strawberry Music Festival 2014).
The Strawberry Music Festival started its journey from Beijing and expanded its exposure to 12 Chinese cities in 2014 drawing 710,000 visitors altogether. The attendance of festival visitors was 150,000 and100, 000 in Beijing and Shanghai respectively. The youth of China is in fact hungry for Modern Sky’s indie music offering and the end result is their prompt growth. “The company makes 75 percent of its income from festivals and the general revenue has increased over 300 percent in the last three years” (Shwartz 2015, par.4).
Modern Sky’s annual Strawberry festival pulls a huge number of spectators in Beijing and Shanghai during its three days performance in May. Proving a tremendous money spinner for Modern Sky, the festival has been a stimulus for many other similar festivals in China (Williamson 2014).
It is one of the biggest and best music festival in the competition and brings forth the most appealing and charismatic indie, punk, metal and electro talents to the big stage (Strawberry festival brings local, foreign talents to Beijing 2014).
Research show that “pop and rock music are most popular among Beijing youth; the statistics show that rock—be it from the west or from China—remains a popular sound for Beijing youth (Kloet 2012).
The co-founder of Split Works (a music company founded with an aim to bring international acts to China), Archie Hamilton believes that a “good festival is encapsulated in the vibe” (Outdoor Music: Split Works 2013, par3).
Hamilton finds the Modern Sky’s festival more promising and attractive for Chinese youth for being a low cost way to have fun in a festival environment and enjoy listening to songs and exchanging thoughts with friends (Outdoor Music: Split Works 2013).
The Modern Sky Festival is an outdoor rock music festival which takes place in Beijing, China’s capital city. The first festival was held in 2007 and has become popular ever since (Jing 2013).
Methodology
This will provide an overview of the methodology and the data collection tools used in to analyze the relationships between motivational factors and satisfied factors that make university students to get involved in music festivals. This part of research deals with research methodology that was employed in conducting the study. It therefore covers primary and secondary research, quantitative analysis, its advantages and disadvantages, questionnaire design, data collection and ethical consideration.
Primary/ Secondary Research
Primary research and secondary research are two different terms which should be implicit in a different way since both the concepts are totally different from each other. Data which is collected from direct experience is called primary data. First the researcher gets some insight of the issue by collecting secondary data then primary research is conducted. This process involves many forms such as questionnaires, direct observation and telephonic interviews. A published data which is collected by others is called secondary data. Secondary data is time saving which one could spend while collecting data. It gives bigger and better data. If any researcher could try to collect on their own, it could be expensive for him. Primary research is considered to be of better quality in comparison to secondary research since a researcher collects data on his own by spending a lot of time in it.
The main advantage of using secondary data is that it is obvious that background work like literature reviews, any case studies etc have already been done. Uses of texts and other statistics have been done and personal contacts have been consumed. On the other hand, there are some drawbacks to the fact that the researcher is not able to check the data face-to-face so it is difficult to check the reliability of the data.
Primary research is generally elaborative because it is used for both qualitative and quantitative purposes but data which is received from secondary research is not much in detail because indirect sources are used in receiving such data.
Primary research is done with too much hard work though secondary research is much easier in comparison to this. Many sources and data are involved in doing secondary research. It includes books, periodicals annual reports, statistical data and case studies etc (Difference between Primary Research and Secondary Research 2011).
It was planned how to reach the people for collecting data. The locale of the study was conducted in various Chinese universities. The choice of location was based on how accessible the organisations were to the researcher based on Singleton’s (1993) argument that the ideal setting for any study should be easily accessible to the researcher.
Primary: Quantitative / Questionnaire (advantages & disadvantages)
The presented research is a quantitative analysis of the effectiveness and a descriptive survey design to investigate if there is any relationship between university students’ motivation and satisfaction of music festival.
The findings aim to provide a detailed analysis of the data from a given population to determine this relationship.
According to Dawson (2009), it is must to know the difference between qualitative and quantitative methods before research methodology starts (Research Methodology: An Introduction n.d.).
Qualitative research involves subjective data. Dawson (2009) mentions that qualitative research focuses on behavior, attitudes and experiences through the methods like, interviews. Since attitudes, behavior and experiences are very important so this kind of research tries to get in depth feeling and opinion from the people who participate in the survey. Qualitative research is done with an aim to improve quality and is often considered as ‘Motivational Research’. It also focuses on people’s opinion about particular subjects or institutions (Research Methodology: An Introduction n.d.).
Quantitative research is a pragmatic approach used for research purposes. The quantified data is captured here. It involves objective data. Large data is collected through questionnaires or structured interviews. Dawson (2009) states that quantitative research aims to target more people and connecting with people is much quicker than it happens in qualitative research. Both the researches need skilful, trained and experienced researchers.
According to Veal (2005), following are some traits of qualitative approach (Research Methodology: An Introduction n.d.):
- This method aims that the researcher understands the personal experiences of the participant in depth.
- It mainly aims for people’s understanding instead of focusing on external causes.
- It helps the researcher to understand the research issues form the point of view of the participants.
- It examines personal changes happened in a period of time.
- It focuses on human-interest issues.
Advantages and disadvantages of Quantitative research:
Advantages
Following are the advantages of Quantitative research:
- Testing already created theories.
- Testing hypothesis which was created before data collection.
- Data is useful for quantitative predictions.
- Helps in collecting data in speed like, telephone interviews.
- Providing accurate, numerical, quantitative data.
- Analyzing data is not much time consuming since it is done with the help of statistical software.
- In this type of research, there may be the possibility of having higher credibility of many powerful people like, politicians, administrators, people funding programs etc.
- This research focuses on studying a large number of population.
Disadvantages
Following are the disadvantages of Quantitative research:
- There is a possibility that the researchers’ categories do not show the understandings of local constituencies.
- It is also possible that the theories of researchers do not depict the understandings of local constituencies.
- Knowledge which is generated from such type of research could be very general and abstract which cannot applied to specific contexts (Strengths and Weaknesses of Quantitative Research n.d.).
Why choosing quantitative
The research methodology that was used in the study is mainly quantitative research method. By using this methodology, the hypotheses of the research questions can be measured, determined, and analyzed. The method also helped in determining the quantity and consistency of results. The method contributed in determining the relationships between university students’ motivation and satisfaction of music festival.
The method used is a descriptive representation of the phenomenon and collect quantifiable data that can be statistically verified and analyzed to measure the effectiveness of the whole research.
Hence, quantitative research technique was used as it was concerned with the quality or kind. This method was chosen because of need to have satisfied value to support the arguments in this study. The analysis of the data was done using SPSS.
Questionnaire design
The following questions were be asked from the students while collecting data from them:
- What motivates you to participate in music festivals?
- What are your expectations when you get involved in the music festivals?
- How often do you get satisfied when you participate in these festivals?
This research technique uses in depth interviews for exploring the better view of the situation. It also intends to know about the understanding of people relating to a particular subject or institution (Research Methodology: An Introduction n.d.).
Moreover, the survey provided important statistical quantitative data to compliment and confirm the findings presented by qualitative data.
The statistical survey provides standardized information about the research subject. It is a well-organized way to gather information regarding the understanding of a subject by a large number of respondents. For the purpose of this study, Likert scale, a bipolar scaling method, is used to construct the questionnaire.
Likert scale is used to construct questionnaires to get psychometric replies from the people. It aims at obtaining the degree of agreement or knowing the preferences of the respondents. These scales do not use comparative techniques, but rather evaluate a single feature. The level of agreement has to be shown with the statements in an ordinal scale (Bertram n.d.).
The Likert Scale is an easy to use system in the surveys. It can be in the form of self- completion questionnaires or can be given as a self-completion part of survey, administered by an interviewer (Brace 2008). In this system, participants are asked to show their degree of agreement with the given statement. Likert scale system uses five-point scale system where the respondents have to pick any one option from the given five points. The 5-point Likert scale was used to measure each statement, with 1 represents strongly disagree, 5 represents strongly agree, and 3 represents neutral. Before the final distribution of the questionnaire, a test research was carried out. For this purpose, 10 copies of questionnaire were sent randomly through email. The aim of the pilot study was to make sure that the questionnaire is easy to understand to the participants. Then the questionnaire was sent to the sample selected for the research.
The design is best suited for this study. The rationale behind the choice of the design is that it studies individuals or objects as whole units and not in parts. The design also investigates the motivational factors and satisfied factors that make Chinese students to get involved in music festivals in depth with a view of understanding it more broadly.
Quantitative research methodology is used because data (perceived effectiveness) being tested in this study was through various sources which support it. The study is guided by the actual data collected from the respondents, and the purpose of the study is to analyze them. Such worldview requires the analysis of the strength of the facts and comments.
This worldview entails a systematic procedure and structure in the research process because it follows a rule-bound approach, which meant that this worldview made use of surveys, content analyses, field experiments, and other assessments that will collect verifiable data (Philimore& Goodson 2004). The worldview also entails the focus on data that will reveal trends, patterns, and statistical relationships. A quantitative research methodology was used because the method utilized open –ended questions as well as close questions; pre-determined approaches, and numeric data (Creswell 2003).
According to Ross (1999), the quantitative method is more frequently associated with using surveys, which entails studying a large number of subjects that is drawn from a specific population. The research design for this study employed the use of survey questionnaires and analyzing data gathered from the respondents.
The study involved the use of the questionnaires. These were prepared in advance, and the questions were reviewed to find their relevancy in the concept being investigated. The language used in the questionnaires was relatively moderate to be understood by the people and the procedure was understood.
There were some short answers type questions too where the participants had to choose just one answer out of five options.
Population and Sampling Procedure
The population of interest for this study is 203 people both male and female from different universities. This distribution is done on the basis of gender, age, education level, monthly income. A large no of participants is used in the sample. Since this is a descriptive design, sampling is a significant process because of the need to obtain an accurate representation of the population (Heck 2004).
Instrumentation
Survey questionnaires were used as the research instrument. The survey was conducted offline as well as online. All the participants were provided with survey questionnaires in order to determine their perceived level of explaining their satisfaction and motivation level to get involved in music festival. The survey instrument was based on the general type of questions related to their understanding about the subject.There were two types of questions open-ended and closed targeting different groups.
Reliability
The data collection method that was used needed to be clearly defined and described; in terms of the how instrument has been tested and validated by past studies (Sunderman, Christopher & Orfield 2004). The strategy for obtaining good measures for the study involves upholding the relevance and appropriateness of the study for the data collected and the purpose of the study. Thus, the instrument section clearly defined the processes for this method, which will enable future researchers to duplicate the study.
In order to uphold the reliability of this study, the participants were selected according to their genders, age, education etc. The questionnaire targeted people from different universities.
Data Collection Procedures
This dissertation captured both primary and secondary data to get proper answers of the research questions. For this study in depth interview was chosen as data collection method. The questionnaire was used for in depth interview. The survey took place offline as well as online so they could feel relaxed and comfortable and could answer the questions with their full thoughts, experiences and feelings. According to Kinnear and Taylor (1979), “In-depth interviews may be defined as an unstructured personal interview which uses extensive probing to get a single respondent to talk freely and to express detailed beliefs and feelings on a topic with little directional influence from the researcher” (as cited in Research Methodology: An Introduction n.d.).
During this procedure the author posted the questionnaire on a website to collect data. At the same the author asked some Chinese university students to fill in the questionnaire.
The target groups for this research were both male and female from different Chinese universities. A sample that is fully representative of attitude and views of the students who were interested in music festivals was selected. Sampling is a technique used by researchers to gather information. It involves selecting individuals or objects from a population or a group for study. The main research instruments to be used in this study were questionnaires, which were accessible both offline and online.
After making the survey questionnaire, some Chinese university students were approached directly but some got access of the questionnaire online.
The test-retest method was used. The questionnaire was given to the respondents to fill for a later scoring. The participants were given sufficient time to complete the questionnaire. After one week, the same questionnaire was given to the group for scoring.
Ethical Consideration: The qualitative research has different ethical problem in comparison to quantitative research. The ethical conflict occurs in connection to how a researcher approaches a community group and what kind of effect he may have on the participants. The main focal point of qualitative research is to define, explore and examine people their likely atmosphere.
Respondents were made aware of the purpose of the study, the researchers agreed not to reveal the identities of the participants and not to disclose their personal information for ethical reasons. All the respondents were made sure that their views on any questions would be kept confidential. This was to win their trust so the quality of data could be good. A particular time frame of the survey was decided and it was determined that interview time would not exceed from the set time and the respondents would not be stressed except they themselves wanted time for answering questions.
Limitations: The limitations that were observed in this study were:
- There was a time limit for completing this project.
- The data gathered from various university students can be biased.
- There was some difficulty to communicate properly to the students.
- Since a part of the survey was done online, it does not disclose the character of the whole students.
Main Findings
Sample Characteristics
In order to understand the distribution of the sample, the distribution of gender, age, education level, monthly income, and times have participated in the music festival are summarized in the following tables and figures.
Table 1:Gender distribution.
Table 1 and figure 1 above summarized the distribution of gender across participants. According to the results, 108 participants are males while 95 are females, accounted 53.2% and 46.8% of the sample respectively.
Table 2: Age distribution.
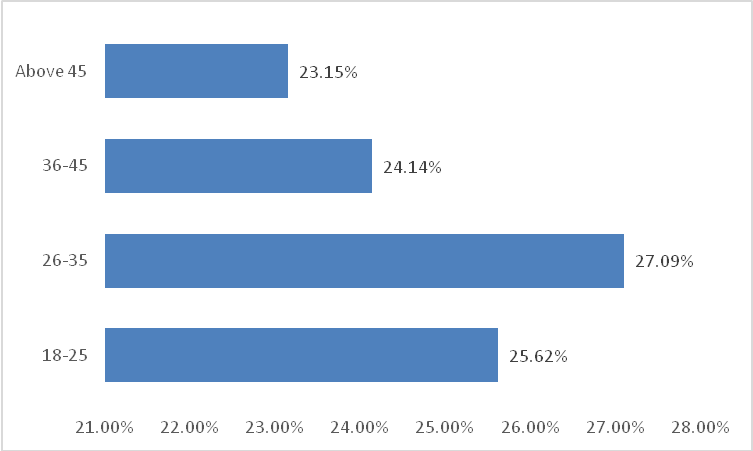
Table 2 and figure 2 show the distribution of age across participants. As shown in the results, 27.09% of the participants aged between 26-35, which is the largest proportion, followed by participants aged between 18 and 25, accounted 25.62% of the sample, and participants aged between 36-45, composed 24.14% of the sample. There are 23.15% of the participants aged above 45.
Table 3: Education distribution.
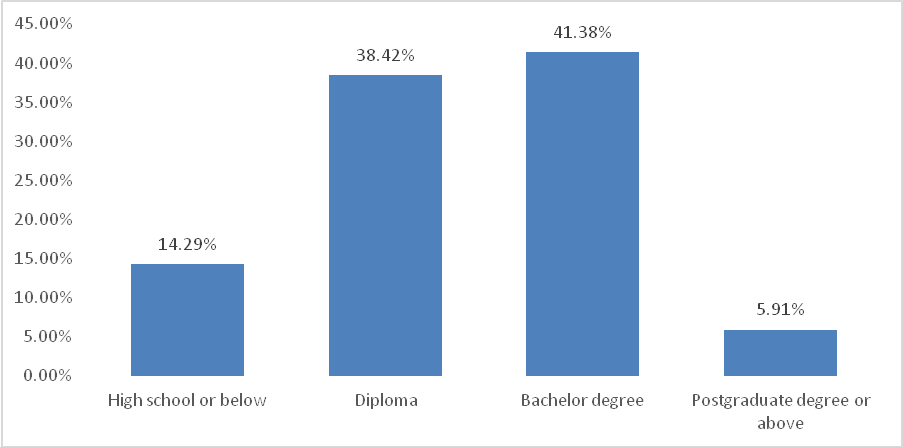
The distribution of education level of the participants are summarized in table 3 and figure 3 above. According to the results, 84 participants have bachelor degree, composed 41.38% of the sample, which is the largest proportion, followed by participants who have diloma, composed 38.42% of the sample, and participants who have high school or below education level, composed 14.29% of the sample. Finally, there are 5.91% of the participants have postgraduate degree or above.
Table 4: Income distribution.
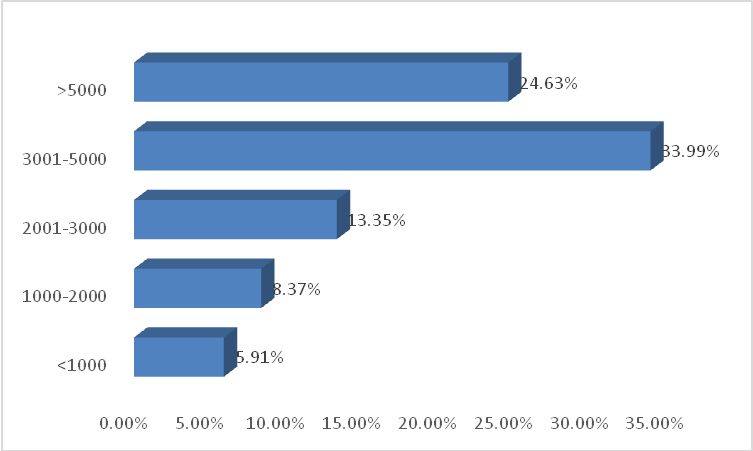
Table 4 and figure 4 summarized the distribution of income among participants. There are 69 participants have income between 3001 and 5000, accounted 33.99% of the sample, followed by participants who have income above 5000, composed 24.63% of the sample, and participants who have income between 3001 and 5000, composed 13.35% of the sample. In addition, there are 17 participants have income between 1000 and 2000, and 12 participants have income less than 1000, composed 8.37% and 5.91% of the sample respectively.
Table 5: Times participated in a music festival.
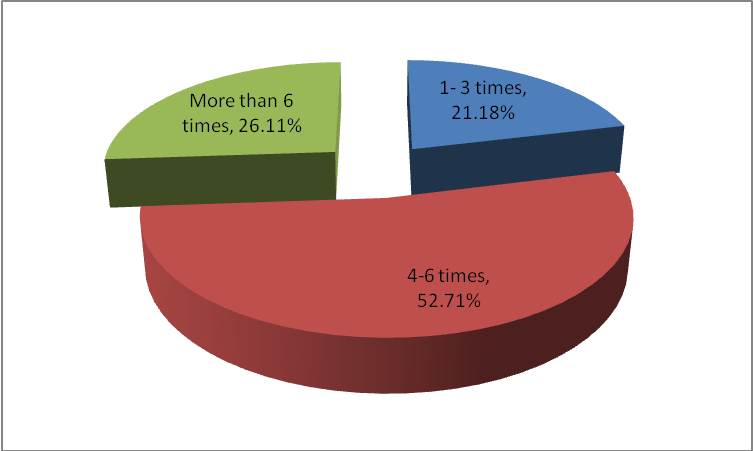
Table 5 and figure 5 summarized the time the participants have attended in music festival. According to the results, more than half (52.71%) of the participants have attended the music festival for 4 to 6 times, followed by participants who have attended the music festival more than 6 times, and participants who have attended the music festival between 1 and 3 times.
Descriptive statistics
Festival image descriptive statistics
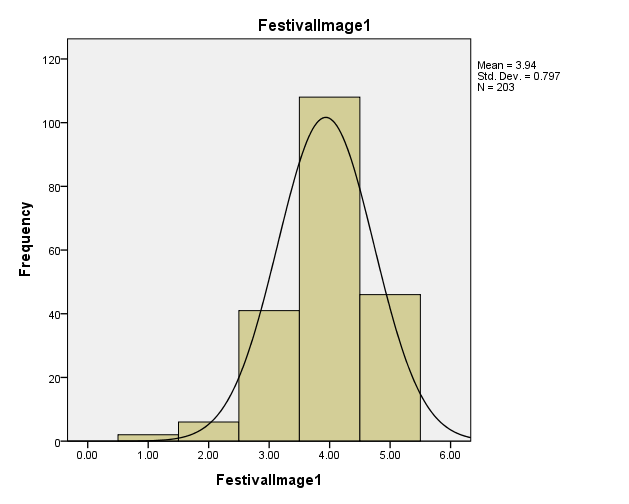
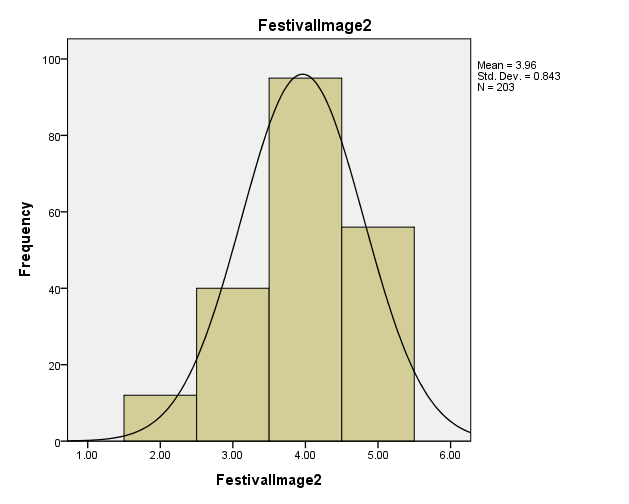
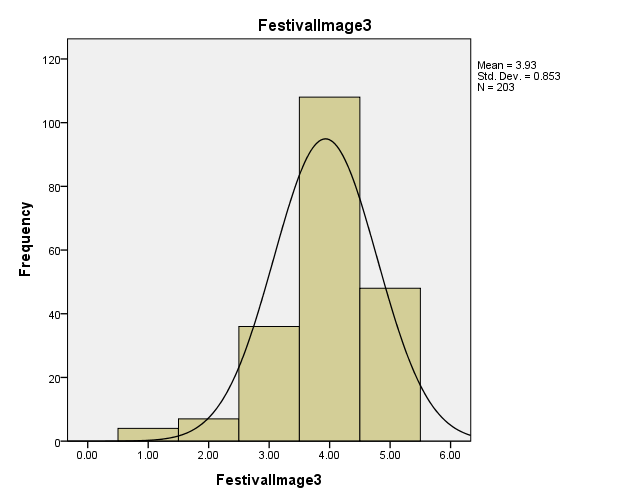
Festival image is composed of 3 statements. In order to check the mean value, standardized deviation, and normality of these 3 statement, the descriptive statistics analysis was conducted on these 3 statements. The results are shown in the following table and figures. The 5-point Likert scale was used to measure each statement, with 1 represents strongly disagree, 5 represents strongly agree, and 3 represents neutral.
Table 6. Festival image descriptive statistics.
According to results in table 6, the mean value of three items measuring festival image is around 3.9, close to 4, indicating a relative positive feeling about the image of the music festival. The skewness of all three items are below 0, indicating that these scores are skewed to the left. However, the skewness statistics and kurotosis statistics value are less than 1, suggesting that the distribution of the score of these three items can be regarded as normally distributed. The following figures 6-8 summarized the histogram and normal curve on histogram. From the normal curve on the histogram it can also be seen that the scores for these 3 items are normally distributed.
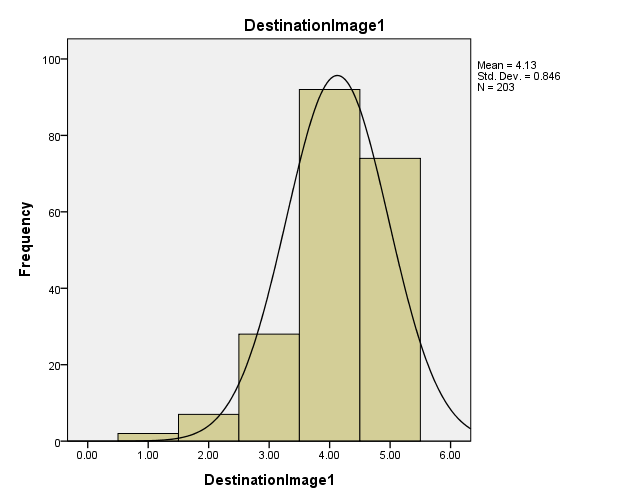
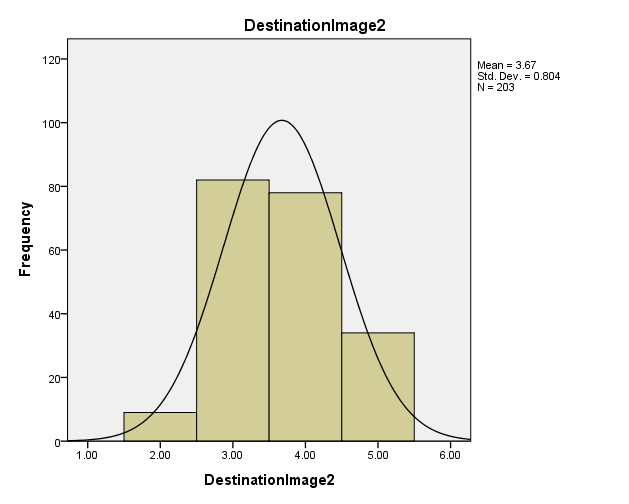
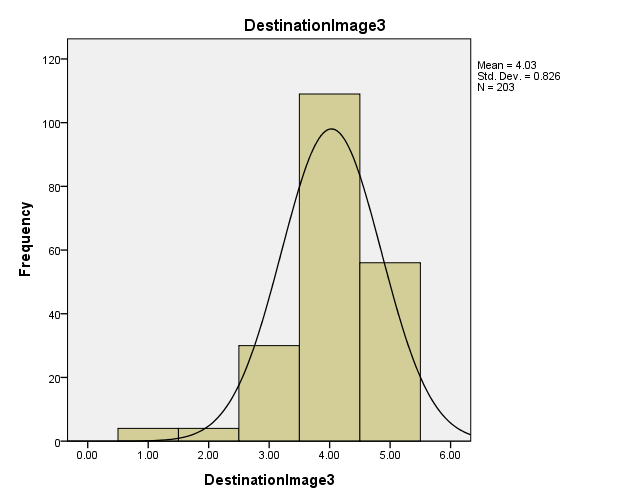
Destination image descriptive statistics
Destination image is composed of 3 statement. The following table and figures show the mean, standardized deviation and normality of these 3 statement.
Table 7. Destination image descriptive statistics.
According to results in table 7, statement 1 “The destination is an ideal place for a fun day trip” has the highest mean value of 4.128, followed by statement 3 “The festival is hold in a destination I prefer”, with mean value of 4.030. The statement 2 “The destination is attractive that I have planned to go to” has the lowest mean value of 3.675. The skewness of statement 1 and 3 are below 0 while the skewness of statement 2 is above 0, indicating that statement 1 and 3 are skewed to the left while statement 2 are skewed to the right. However, the skewness statistics and kurotosis statistics value are less than 1, suggesting that the distribution of the score of these three items can be regarded as normally distributed. The following figures 9-11 summarized the histogram and normal curve on histogram. From the normal curve on the histogram it can also be seen that the scores for these 3 items are normally distributed.
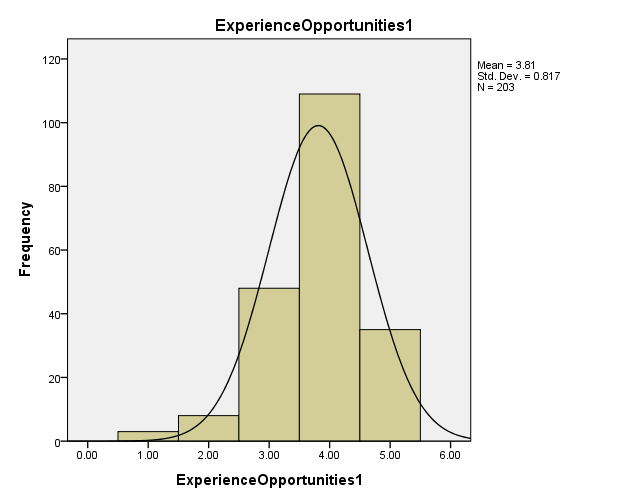
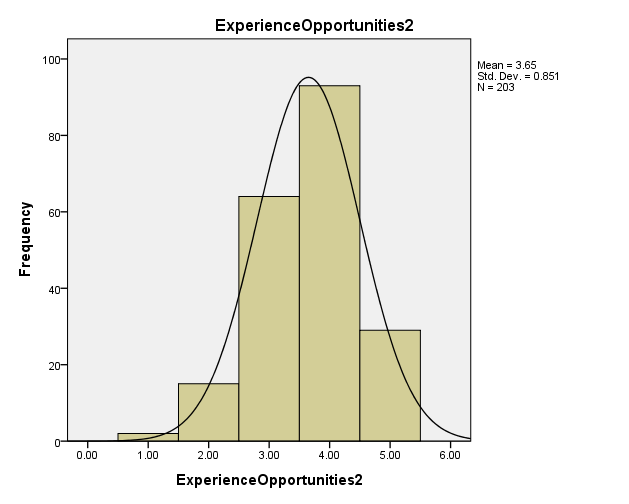
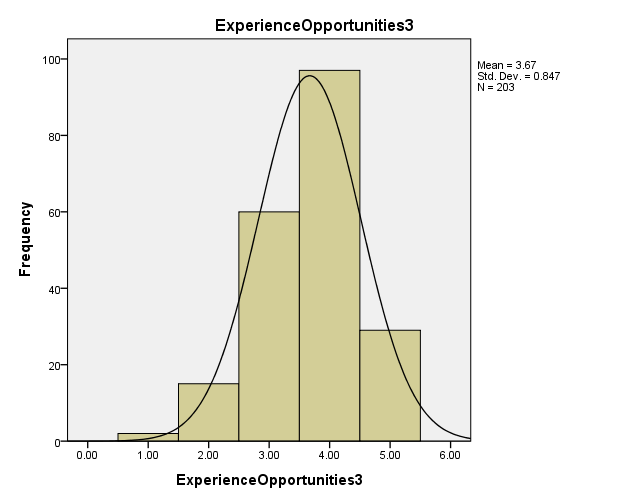
Experience opportunities descriptive statistics
Experience opportunities is also composed of 3 statement. The mean value, standardized deviation, and normality of these three statement are summarized in table and figure below.
Table 8. Experience opportunities descriptive statistics.
According to the results, the statement 1 “This festival is an unique experience” has the highest mean value of 3.813, followed by statement of “There are things that worth me to see and do in the festival”, with mean value of 3.670. Generally the mean value of these three items are higher than 3 but less than 4, indicating a medium to high level positive attitude towards the experience opportunities. The skewness statistics and kurotosis statistics value are less than 1, suggesting that the distribution of the score of these three items can be regarded as normally distributed. The following figures 12-14 summarized the histogram and normal curve on histogram. From the normal curve on the histogram it can also be seen that the scores for these 3 items are normally distributed.
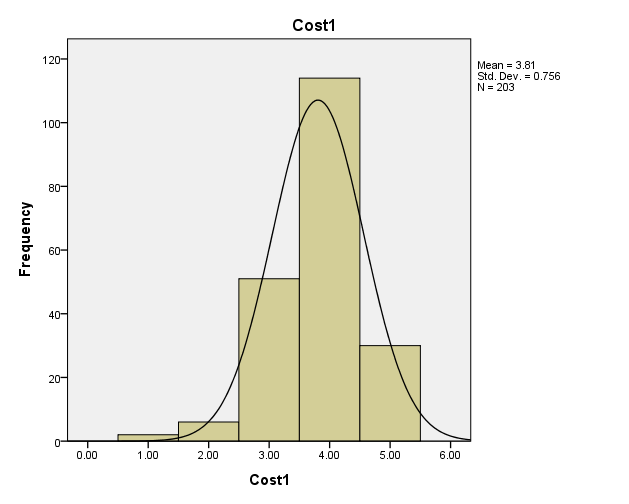
Cost descriptive statistics
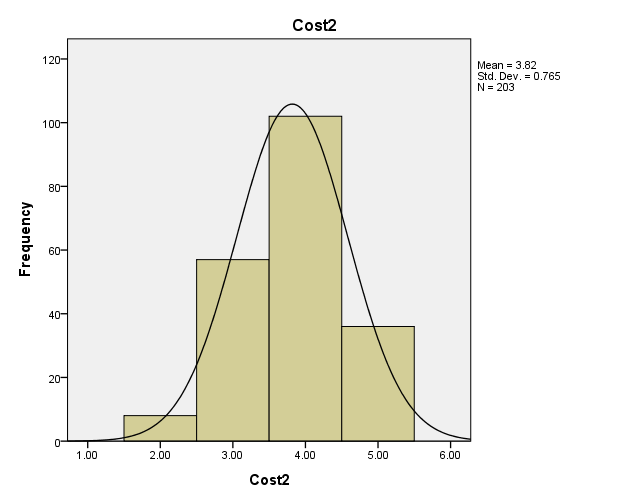
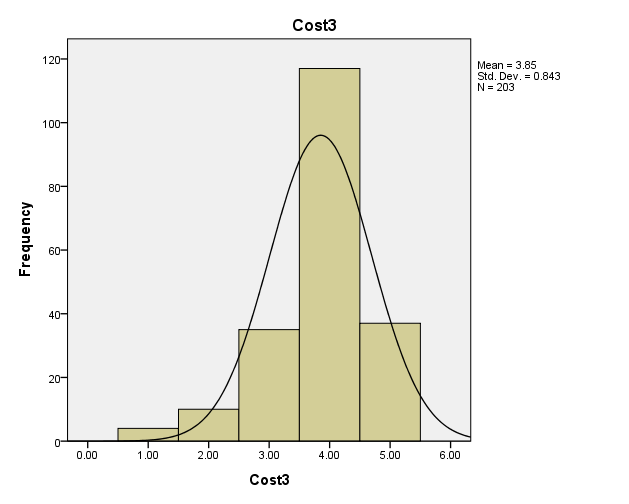
Cost is composed of 3 items. In order to check the mean value, standardized deviation, and normality of these 3 statement, the descriptive statistics analysis was conducted on these 3 statements. The results are shown in the following table and figures.
Table 9. Cost descriptive statistics.
According to the results, all of these three items have mean value around 3.8, indicating a relatively high level of the perceived cost of the music festival. The skewness of all 5 statements are below 0, indicating that theses scores are skewed to the left. However, all the skewness statistics and kurotosis statistics values are less than 1, indicating that the scores of these 3 statements can be regarded as normally distributed. The histograms and normal curve on histogram are shown in the following figures. It can also be seen that all of these 3 statements are normally distributed.
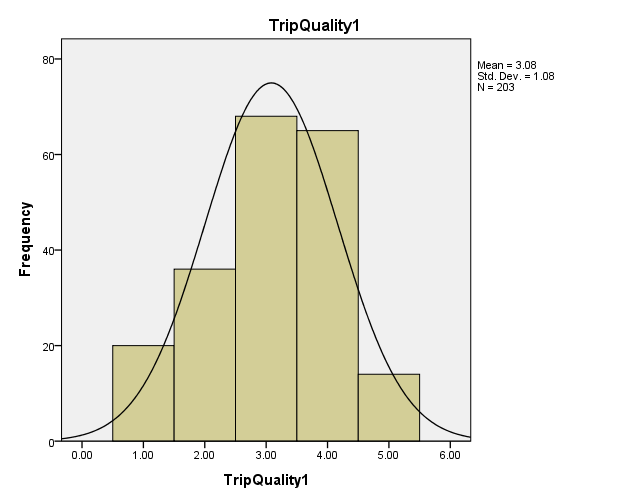
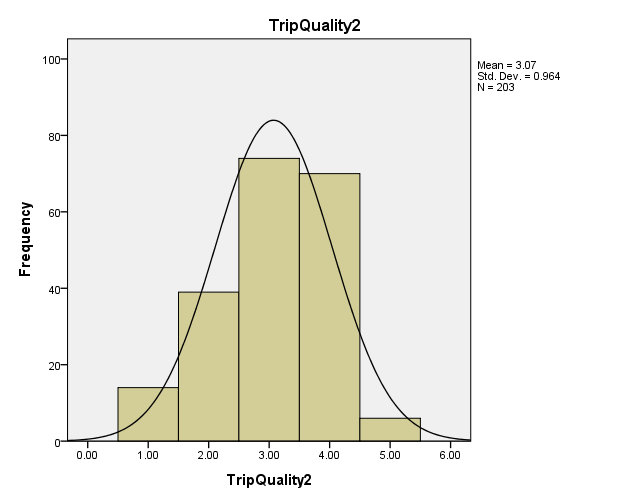
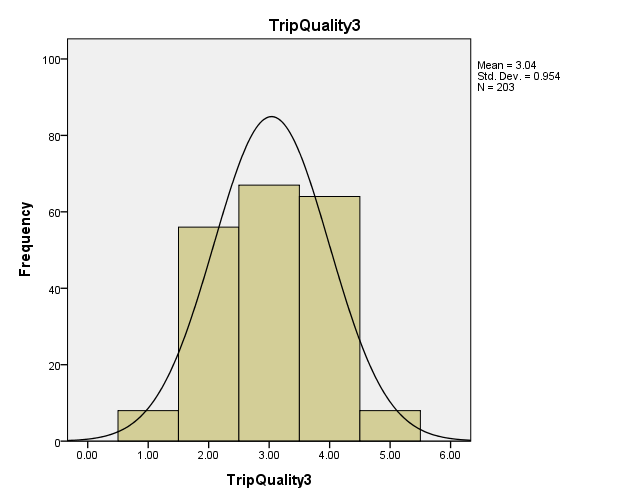
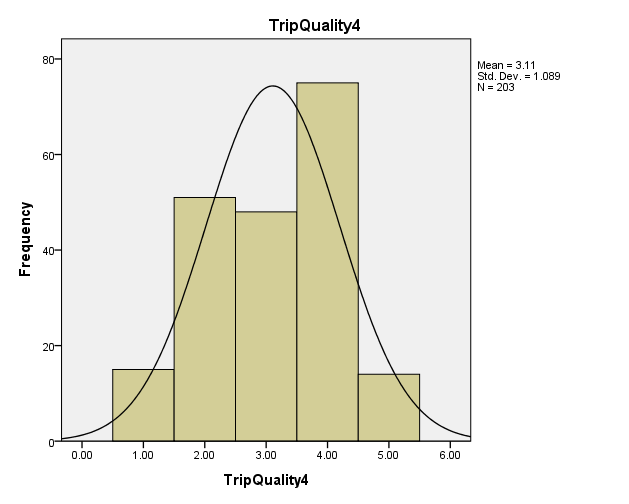
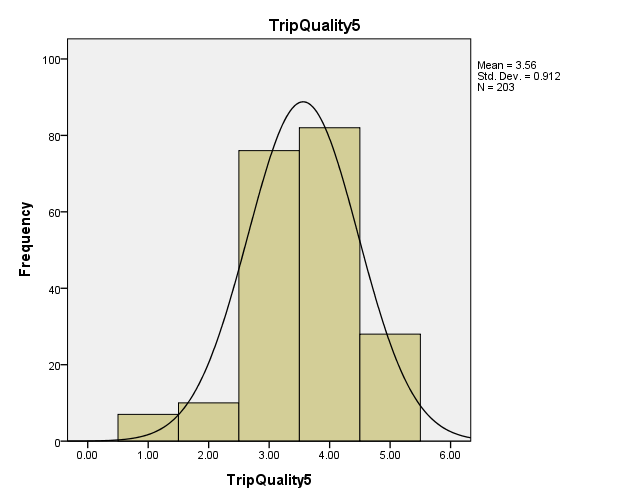
Trip quality descriptive statistics
Trip quality is composed of 5 items. In order to understand the mean, standardized deviation, and normality of these 5 items, the descriptive statistics are summarized in the following table and figures.
Table 10. Trip quality descriptive statistics.
According to results in table 10, the statement “It is convenient for the transportation” has the highest mean value of 3.562, followed by statement of “The accommodation is satisfactory”, with mean value of 3.108. The other three statement “Peope at the destination are warm and friendly”, “It is safe at the festival”, “I have my family/friends together to attend the music festival”, have mean value around 3. The results indicate that the participants’ attitude to the trip quality is neutral, with mean vaue around 3. All the skewness statistics and kurotosis statistics values are less than 1, indicating that the scores of these 3 statements can be regarded as normally distributed. The histograms and normal curve on histogram are shown in the following figures. It can also be seen that all of these 3 statements are normally distributed.
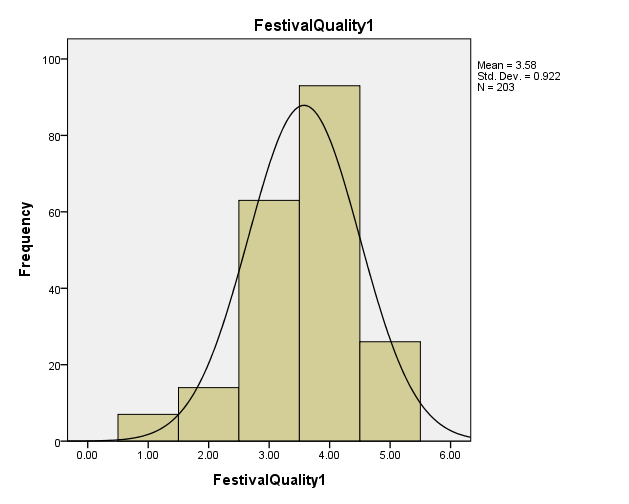
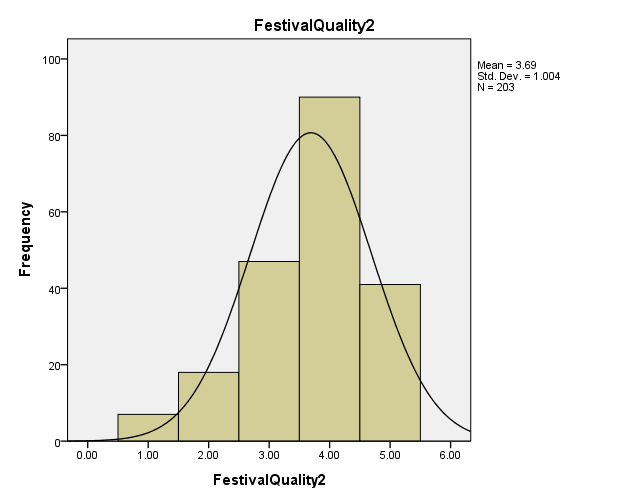
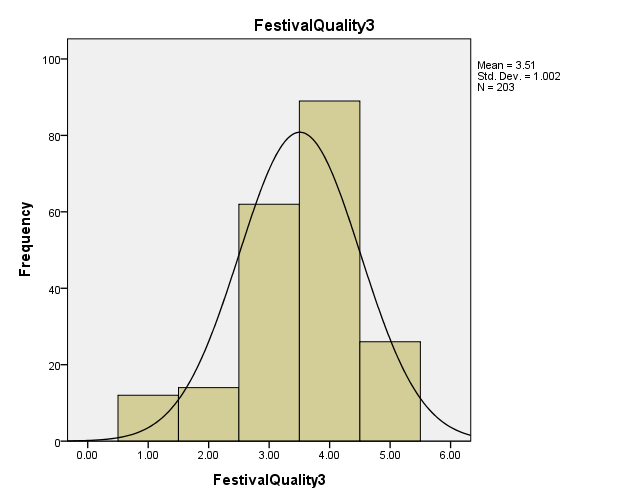
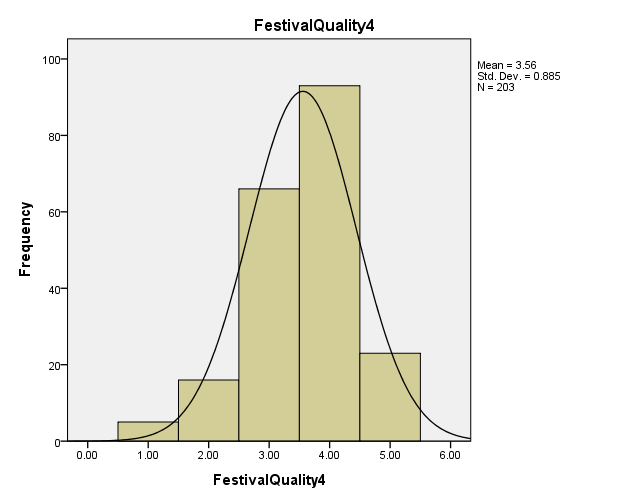
Festival quality descriptive statistics
Festival quality is composed of 4 items. Table 11 summarized the mean, standardized deviation, and normality of these 4 items. Figure 23-26 show the histogram and normal curve on histogram of these 4 item scores. According to the results, the statement 2 “The sound quality is well” has the highest mean value of 3.69. The other 3 statements have nearly same mean value around 3.5, indicating that the festival quality is at a medium level as perceived by participants.
The skewness of all four items are below 0, indicating that these scores are skewed to the left. However, the skewness statistics and kurotosis statistics value are less than 1, suggesting that the distribution of the score of these three items can be regarded as normally distributed. The following figures 23-26 summarized the histogram and normal curve on histogram. From the normal curve on the histogram it can also be seen that the scores for these 4 items are normally distributed.
Table 11. Festival quality descriptive statistics.
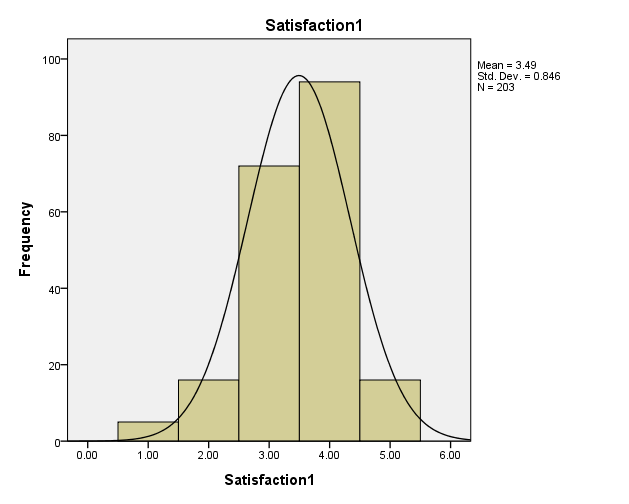
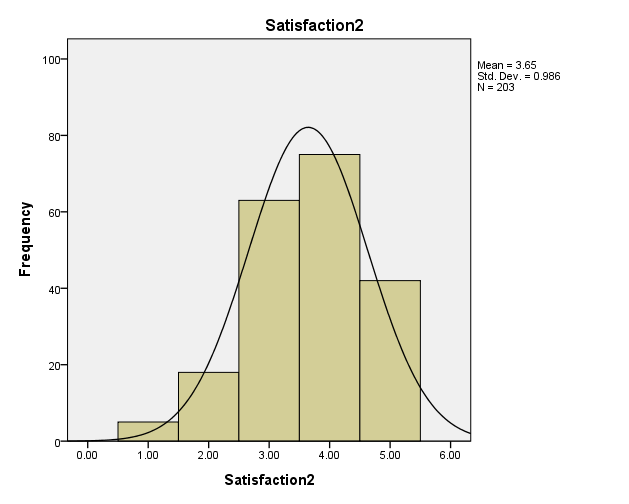
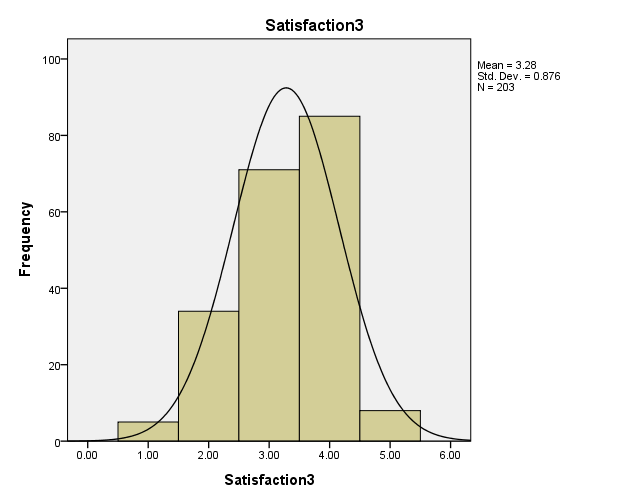
Satisfaction descriptive statistics
Satisfaction is composed of three items. The following table and figures summarized the mean, standardized deviation, and normaility of these three items. According to the results in table 12, the mean value of statement 2 “ I am not regret to participate in the music festival” has the highest mean value of 3.645, followed by statement 1 “Overall, I am satisfied with experience of participating in the music festival” with mean value of 3.49. This indicates that participants’ satisfaction is at a medium level. The skewness of all three items are below 0, indicating that these scores are skewed to the left.
However, the skewness statistics and kurotosis statistics value are less than 1, suggesting that the distribution of the score of these three items can be regarded as normally distributed. The following figures 27-29 summarized the histogram and normal curve on histogram. From the normal curve on the histogram it can also be seen that the scores for these 3 items are normally distributed.
Table 12. Satisfaction descriptive statistics.
Reliability Analysis
The reliability analysis evaluates whether multiple items are measuring the same concept or construct. The Cronbach’s Alpha is frequently used to measure the reliability in SPSS. Specifically, if the Cronbach’s Alpha value is above 0.7, then the items measuring the concept can be regarded as reliable and internal consistent. In this study, the Cronbach’s Alpha value was adopted to measure the reliability of the items measuring various constructs. In addition, the Corrected Item-Total Correlation (CICT) was also produced to evaluate whether each individual item is reliable and valid. The minimum requirement of CICT is 0.5.
Festival image
The Cronbach’s Alpha value forfestival inmage is 0.742, which is above the minimum requirement of 0.7, indicating that the items measuring festival image is reliable and internal consistent. By inspecting the CICT, it is found that all of three items have CICT values above 0.5, indicating that there is no problematic statement with low correlation among measurement items
Table 13. Reliability of Festival Image.
Destination image
The Cronbach’s Alpha value for destination image is 0.750, which is above the minimum requirement of 0.7, indicating that the items measuring destination image is reliable and internal consistent. By inspecting the CICT, it is found that all of three items have CICT values above 0.5, indicating that there is no problematic statement with low correlation among measurement items.
Table 14. reliability of Destination image.
Experience opportunities
The Cronbach’s Alpha value for experience opportunities is 0.859, a relatively high level reliability value, indicating that the items measuring experience opportunities is reliable and internal consistent. By inspecting the CICT, it is found that all of three items have CICT values above 0.5, indicating that there is no problematic statement with low correlation among measurement items
Table 15. reliability of Experience opportunities.
Cost
The Cronbach’s Alpha value for cost is 0.795, which is above the minimum requirement of 0.7, indicating that the items measuring cost is reliable and internal consistent. By inspecting the CICT, it is found that all of three items have CICT values above 0.5, indicating that there is no problematic statement with low correlation among measurement items
Table 16. reliability of Cost.
Trip quality
The Cronbach’s Alpha value forfestival inmage is 0.745. As a relatively medium level reliability value, this also indicates that the 5 items measuring trip quality in internal consistent and reliable. By inspecting the CICT, it is found that all of the 5 items have CICT values above 0.5, indicating that there is no problematic statement with low correlation among measurement items
Table 17. reliability of Trip quality.
Festival quality
The Cronbach’s Alpha value for festival quality is 0.739, which is above the minimum requirement of 0.7, indicating that the items measuring festival quality is reliable enough. By inspecting the CICT, it is found that all of three items have CICT values above 0.5, indicating that there is no problematic statement with low correlation among measurement items
Table 18. reliability of Festival quality.
Satisfaction
The Cronbach’s Alpha value for satisfaction is 0.859, a relatively higher level reliability, indicating that these three items can measure satisfaction well enough. By inspecting the CICT, it is found that all of three items have CICT values above 0.5, indicating that there is no problematic statement with low correlation among measurement items
Table 19. reliability of Satisfaction.
Correlation analysis
Correlation between Festival image and Satisfaction
In order to check the correlation between festival image and satisfaction, a scatterplot was created. As shown in Figure 30 below, there is a positive correlation between festival image and satisfaction.
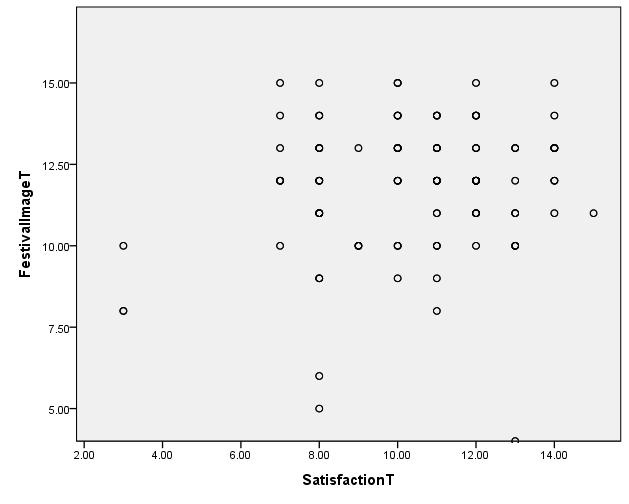
After inspected the positive correlation between festival image and satisfaction, a correlation analysis was conducted and the results are shown in table 20 below. According to the results, festival image has a positive and significant relationship with satisfaction, with correlation value of 0.161 and significant at 0.05 level. As correlation value below 0.3 represents weak corraltion, this results indicate that festival image has a weak correlation with satisfaction. In other words, better festival image will lead to higher level satisfaction.
Table 20. Correlation between Festival image and Satisfaction.
Correlation between Destination image and Satisfaction
In order to check the correlation between destination image and satisfaction, a scatterplot was created. As shown in Figure 31 below, there is a positive correlation between destination image and satisfaction.
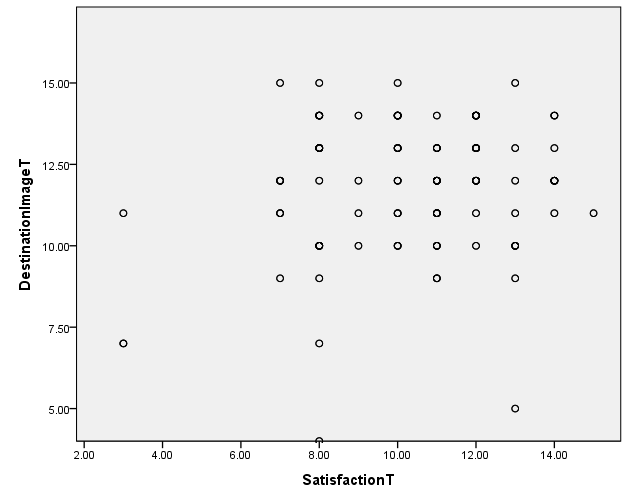
After inspected the positive correlation between destination image and satisfaction, a correlation analysis was conducted and the results are shown in table 21 below. According to the results, destination is significant and positively related to satisfaction, with correlation value of 0.157 and significant at 0.05 level. As correlation value below 0.3 represents weak corraltion, this results indicate that destination image has a weak correlation with satisfaction. In other words, better destination image will lead to higher level satisfaction.
Table 21 Correlation between Destination image and Satisfaction.
Correlation between Experience opportunities and Satisfaction
In order to check the correlation between experience opportunities and satisfaction, a scatterplot was created. As shown in Figure 32 below, there is a positive correlation between destination image and satisfaction.
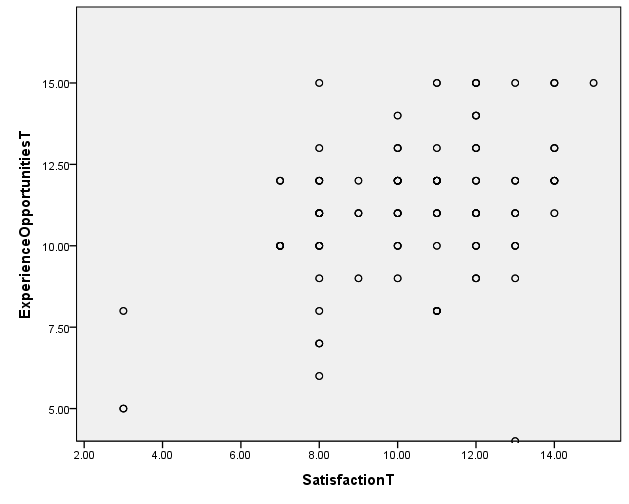
After inspected the positive correlation between experience opportunities and satisfaction, a correlation analysis was conducted and the results are shown in table 22 below. According to the results, experience opportunities is significant and positively related to satisfaction, with correlation value of 0.402 and significant at 0.01 level. As correlation value between 0.4 and 0.6 represents medium corraltion, the results indicate that experience opportunities has a medium level correlation with satisfaction.
Table 22. Correlation between Experience opportunities and Satisfaction.
Correlation between Cost and Satisfaction
In order to check the correlation between cost and satisfaction, a scatterplot was created. As shown in Figure 33 below, there is a strong correlation between cost and satisfaction.
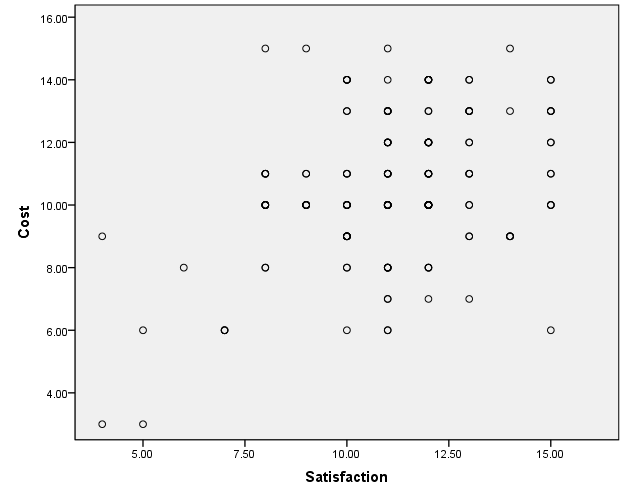
A correlation analysis was conducted to confirm the relationship between cost and satisfaction. The results are shown in table 23 below. According to the results, cost is significantly related to satisfaction, with pearson correlation of 0.381, and significance value of 0.000, which is below 0.05.
Table 23. Correlation between Cost and Satisfaction.
**. Correlation is significant at the 0.01 level (2-tailed).
Correlation between Trip quality and Satisfaction
In order to check the correlation between trip quality and satisfaction, a scatterplot was created. As shown in Figure 34 below, there is no clear correlation between cost and satisfaction.
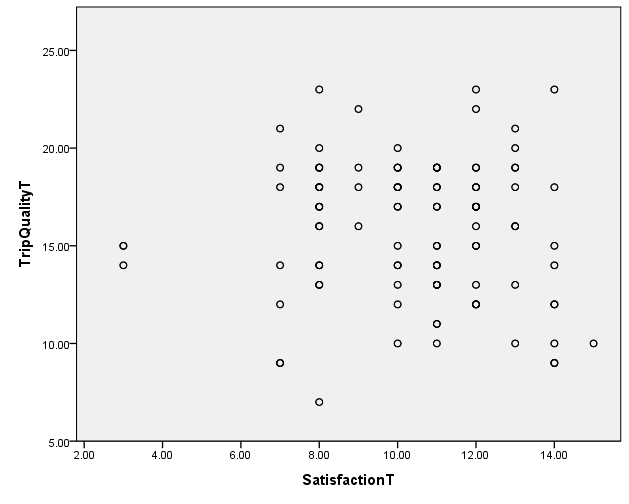
A correlation analysis was conducted to confirm the relationship between trip quality and satisfaction. The results are shown in table 24 below. According to the results, cost is not significantly related to satisfaction, with significance value of 0.329, which is above 0.05.
Table 24. Correlation between Trip quality and Satisfaction.
Correlation between Festival quality and Satisfaction
In order to check the correlation between festival quality and satisfaction, a scatterplot was created. As shown in Figure 35 below, there is a positive correlation between festival quality and satisfaction.
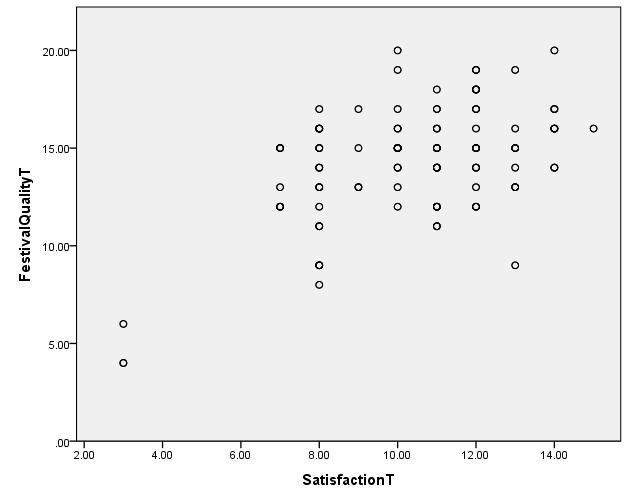
After inspected the positive correlation between festival quality and satisfaction, a correlation analysis was conducted and the results are shown in table 25 below. According to the results, festival quality is significant and positively related to satisfaction, with correlation value of 0.508 and significant at 0.01 level. As correlation value between 0.4 and 0.6 represents medium corraltion, the results indicate that festival quality has a medium level correlation with satisfaction.
Table 25. Correlation between Festival quality and Satisfaction.
Regression analysis
Regression analysis is used to evaluate the impact of independent variables on dependent variable (Wagner, 2009). More specifically, regression analysis is normally used to understand how the change of independent variable can affect the change of dependent variables (Wagner, 2009). The correlation analysis above indicated that there are relationships between festival quality, experience opportunities, destination image, experience opportunities and satisfaction. In order to find out how these variables influence customer satisfaction and which one has the biggest impact, the multiple linear regression is used.
Table 26: Model Summary.b
The adjusted R square is 0.459, indicating that the independent variables of festival quality, trip quality, cost, festival image, destination image, and experience opportunities can explain 45.9% of the variance of satisfaction
Table 27: ANOVA.a
By summarizing the ANOVA table, it can be said that the independent variables of festival quality, trip quality, cost, festival image, destination image, and experience opportunities can predict the dependent variable of satisfaction at a significance of 0.01, by considering F=12.757.
Table 28: Coefficients.a
Results in table 28 above show that festival image, destination image, experience opportunities, cost, and festival quality can significantly and positively impact satisfaction, with significance value all below 0.05. Specifically, festival quality has the biggest impact on satisfaction, with standardized coefficient of 0.462, followed by experience opportunities, with standardized coefficient of 0.360, and cost, with standardized coefficient of 0.288. However, trip quality was found to have no significant impact on satisfaction, with significance value of 0.727, which is higher than 0.05. From these results, it can be concluded that H1, H2, H3, H4, H6 are supported while H5 is rejected.
Conclusion
This study has attempted to analyse the relationship between the Chinese university students’ motivational factors and their satisfaction with respect to participation in the Strawberry Music Festival in China. Motivational factors such as festival image, destination image, experience opportunities cost, trip quality and festival quality are found to be positively related to satisfaction of the students.
According to the results, more than half (52.71%) of the participants have attended the music festival for 4 to 6 times. It is evident through previous research that music festivals work as powerful mediums for inspiring, motivating and stirring transformation for an improved world. Chinese students also observe these festivals as a common platform for gathering, making relationships with other people and celebrating with others. They use this platform for building self-identity and active participation in music festivals allows them to express their feelings, uplift their moods and provide them opportunity to experience things of their interests.
It is observed that the image of the music festival is a motivating factor for the students. The destination image is also positively related to students’ motivation to participate in the Strawberry Music Festival. Most of them responded that they participated in the festival because the destination was an ideal place for a fun day trip. It is evident in previous research that people want to visit music festival because they want to seek pleasure and avoid the boredom of daily routine life.
The students’ felt that they could gain a unique experience through participation in the Strawberry Music Festival. Researchers believe that students are interested in visiting the music festivals to gain a whole new experience than that of their usual surroundings. Being free from the college routine and enjoying with friends in doing something of their choice gives them excitement. Meeting family and relatives and socializing with friends and new people are definitely the motivating factors for students to attend the music festivals. Young generation is always keen on making new contacts and exchanging their views with others.
With respect to the push and pull factors, it is found that the same event type is capable of satisfying different needs. Students’ expectation with the Strawberry Music Festival is influenced by both ‘push and pull’ factors. As Iso- Ahola (1982) describes that any leisure activity is seen as a potential satisfaction provider by people because it offers some intrinsic rewards like tones of mastery and capability and allows them to come out of their routine environment. Generally, both the components are present in the leisure motivation and specifically in tourism motivation though their significance varies for different groups or individuals.
A significant level of satisfaction was observed among the students with their visit to the Strawberry Music Festival. Their needs to explore something new and different, interesting and exciting were fulfilled. Crompton & McKay (1997) believe that satisfaction will result with the fulfilment of the needs. Besides, the desire to be with family and friends and socialize with new people also fulfilled.
The correlation analysis indicated that there are relationships between festival quality, experience opportunities, destination image, experience opportunities and satisfaction. Further, the multiple linear regression analysis indicates that festival image; destination image, experience opportunities, cost, and festival quality can significantly and positively impact satisfaction. Festival quality has the biggest impact on satisfaction followed by experience opportunities, and cost. However, trip quality was found to have no significant impact on satisfaction. The analysis of the data leads to the conclusion that H1, H2, H3, H4, H6 are supported while H5 is rejected.
Suggestions
Music festivals are unique events and need appropriate planning in order to become significant and remarkable tourists’ destinations. Tourism authorities need to identify factors that affect peoples’ decisions about their holiday destinations for planning their activities more effectively (Kassean & Gassita 2003).
The organizers should make efforts to gather information about the motivational factors that drive people to participate in music festivals. Accordingly, they should plan their programs and advertisements based on their expectations and needs. It is good for covering up any loopholes in the events and makes them a success by providing greater level of satisfaction to the visitors (Crompton &McKay 1997).
Popescu and Carbos (2012) believe that events need to be appropriately planned including all the minute details into consideration. The organizers of the festivals and events have to work logically in order to augment the level of satisfaction among the participants and the audience (Popescu & Carbos 2012).
For this purpose “a successful matching of the push and pull motives is essential for a marketing strategy in destination areas, and the examination of the motives are useful in segmenting markets, designing promotional programs, and decision making about destination development” (Mohammad & Som 2010, p.44).
Studies reveal that music has the power to improve positive emotions and wellbeing (Harrison, 2014). The most important thing that a music festival should generate is the feeling of fun. Another important thing is a beautiful setting. Though people hardly travel in China, but music festivals need to create such pull that people are compelled to visit the festival irrespective of the distance of the venue (Outdoor Music: Split Works 2013).
It is important that the possible negative impacts of the music festivals on the students like drug or alcohol abuse, antisocial behaviour should be researched in order to design preventive measures in this connection. Deeper study is required into the ways of offering better music festival experiences, enhancing their positive outcomes and mitigating their negative impacts. Such knowledge may help students to make better choices with respect to participation in the music festivals leading to improved, fruitful and satisfying lives.
It is further required that the festival designers should not only depend on the manifestation of arts but also encompass the unified theory of festival experiences. Further, the worth of festivals and other celebrations has to conceptualized in terms other than those found in the event tourism discourse, with emphasis on personal, societal and cultural contributions”(Getz 2010, p.21).
The present study indicates that festival quality, experience opportunities, cost have significant impact on satisfaction, hence, organizers should appropriately look into all the minute details of these elements while planning the events. They should work rationally in order to enhance the level of satisfaction among the participants and the audience of the music festivals.
Contributions and implications
This research will be helpful to the organizers in providing better offerings so that more students and visitors get attracted towards the Strawberry Music Festival and the desirability of the festival can be augmented. An attempt has been made through this research to throw light on the factors that motivate the Chinese students’ to visit the popular music festivals in China and their experiences with respect to the festival image, destination image, opportunities to involve in different exciting activities, trip quality and festival quality etc. The results of the study may provide direction to the organizers in terms of improvement in the problem areas and suggest them useful tips for increasing the attractiveness and desirability of the festival.
Limitations
The present research wasfocused on the Chinese university students’ participation in the music festivals; hence, the results cannot be applied to the overall population and may vary in different settings. Further, there is a possibility of biasness on the part of the university students with respect to festival image or destination image as different people have different motivations for travelling and students’ choices for travel and leisure destinations are followed by a wide array of motivations. Besides this, there could be possibility of students not knowing the real reasons of their participation in the music festival. Dann’s (1981) assertion about the limitations in collecting real data from tourists applies to this research work too. According to him, investigating the actual reasons behind tourists travelling may be affected because:
- Tourists may not wish to reflect on the real festival participation motives.
- Tourists may be unable to reflect on real travel motives.
- Tourists may not wish to express real travel motives.
- Tourists may not be able to express real travel motives (as cited in Williams 2004, p.76).
Moreover, there could a possibility of miscommunication and miscalculation as the part of the survey and data collection is done online.
Ethical considerations
In order to maintain the ethical value of the research, it was kept under consideration that the time and studies of the students do not get affected by the survey. For this purpose most of the survey questionnaires were distributed online and time frame was set for part of the survey that was conducted personally. However, respondents were given sufficient time to complete their survey. Respondents were made aware of the purpose of the study and were assured about the privacy of their identities and personal information for ethical reasons. All the respondents were made sure that their views on any questions would be kept confidential in order to win their trust and receiving unbiased and authentic data from them.
Future research work
This research was an attempt to understand the Chinese students’ motives for participating in the Strawberry Music Festivals and the relation between their motives and satisfaction level with the festival. The study deduces the conclusion that there is a positive correlation between the Chinese university students’ motivations and satisfaction with respect to visiting the particular festival. However, in view of the significance of subject and its usefulness for the festival organizers, future research is recommended in this field.
References
2014 Strawberry Music Festival. 2014. Web.
Abreu-Novais, M & Arcodia, C. 2013. ‘Music festival motivators for attendance: Developing an agenda for research.’ International Journal of Event Management Research, vol. 8, no. 1, pp. 34-48. Web.
Ajzen, I & Fishbein, M, n.d. The influence of attitude on behaviour. Web.
Baez-Montenegro, A & Devesa-Fernandez, M. 2014. Motivation, satisfaction, and loyalty in cultural participation: The case of film festival. Web.
Baker, D A, & Crompton, J L. 2000. ‘Quality, satisfaction and behavioural intentions.’ Annals of Tourism Research, vol. 27, no. 3, pp. 785-804. Web.
Ballantyne, J, Ballantyne, R & Packer, J, 2014. ‘Designing and managing music festival experiences to enhance attendees’ psychological and social benefits,’ Musicae Scientiae, vol. 18, no. 1, pp. 65-83, Web.
Bertram, D, n. d, ‘Likert Scales…are the meaning of life’. CPSC 681 – Topic Report. Web.
Boer, J, Brussee, R, Rovers, M & Vilet, H, n.d.. Social media and festival experience. Web.
Brace, I. 2008. Questionnaire Design: How to Plan, Structure and Write Survey Material for Effective Market Research, 2 ed., Kogan Page Publishers, United States.
Celik, S & Cetinkaya, M Y, 2013. ‘Festivals in event tourism: The case of international Izmir art festival, International Journal of Contemporary.’ Economics and Administrative Sciences, vol. 3, no. 1, pp. 1-21. Web.
Cha, S, Mccleary, K W & Uysal, M, 1995, ‘Travel motivations of Japanese overseas travellers: A factor-Cluster segmentation approach’. Journal of Travel Research. vol. 35, no. 1 pp. 33-39. Web.
Chi, C G & Qu, H, 2008, ‘Examining the structural relationships of destination image, tourist satisfaction and destination loyalty: An integrated approach’. Tourism Management, vol. 29, no. 4, pp. 624-636. Web.
Chinese Culture. n.d. Web.
Chung, C, 2014, ‘Study on relationship between visitor value, degree of satisfaction and loyalty in musical festival activity’. JSSM, vol. 7, no. 6, pp. 390-395. Web.
Cohen, S & Taylor, L. 1992. Escape attempts: The theory and practice of resistance to everyday life, Routledge, London
Creswell, J W. 2003. ‘Research design: Qualitative, quantitative, and mixed methods approaches,’ Thousand Oaks, Sage Publications, CA.
Crompton, J L. 1979. Motivations for pleasure vacation, Web.
Crompton, J L, & McKay, S L, 1997. ‘Motives of visitors attending festival events,’ Annals of Tourism Research, vol. 24, no. 2, pp. 425-439. Web.
Difference between Primary Research and Secondary Research. 2011. Web.
Dikmen, F & Bozdaglar, H, 2013. ‘Motivations for Attendance at International Bellapais Music Festivals: A case study of North Cyprus’. Interdisciplinary Journal of Contemporary Research in Business, vol. 5, no. 2. Web.
Fournier, S, & Mick, D G, 1999, ‘Rediscovering satisfaction.’ Journal of Marketing, vol. 63, pp. 5-23. Web.
Frisch, N. 2010. A pioneer in Chinese music festivals. Web.
Getz, D, 2010, ‘The nature and scope of festival studies,’ International Journal of Event Management Research, vol. 5, no.1, pp.1-47, Web.
Geus, S, Richards, G & Toepoel, V, 2013. ‘The Dutch Queen’s Day Event”, How subjective experience mediates the relationship between motivation and satisfaction’. International Journal of Event and Festival Management, vol. 4, pp. 156-172. Web.
Glastonbury 2014 tickets sell out in record time. 2013. Web.
Gnoth, J, 1997. ‘Tourism motivation and expectation formation’. Annals of Tourism Research, vol. 24, no. 2, pp. 283-304. Web.
Graham, S & Weiner, B, n.d., Theories and principles of motivation. Web.
Goulding, C, Shankar, A & Elliot, R, 2001,’Dance Clubs, Rave, and the Consumer Experience: an Exploratory Study of a Subcultural Phenomenon.’ E – European Advances in Consumer Research, vol. 5, pp. 203-208. Web.
Hargreaves, D J, Miell, D & Macdonald, R A R. 2002. What are musical identities and why are they important?. Web.
Heck, R, 2004. Studying educational and social policy: Theoretical concepts and research methods. Mahwah, Lawrence Erlbaum Associates, NJ.
Iso-Ahola, S E, 1982. ‘Toward a social psychological theory of tourism motivation: A rejoinder’. Annals of Tourism Research, vol. 9, no. 2, pp. 256-262. Web.
Jafari, J, 2003. Encyclopaedia of tourism, Routledge, London.
Jing, Z, 2013, Top 10 Chinese music festivals. Web.
Juslin, P N & Sloboda, J A. 2001. Music and emotion: Theory and research. Web.
Juslin, P N, Liljestrom, S, Vastfjall, D, Barradas, G, & Silva, A, 2008. ‘An experience sampling study of emotional reactions to music: listener, music and situation’. Emotion, vol. 8, no. 5, pp. 668-683, Web.
Kanagaraj, C & Bindu, T, 2013. ‘An analysis of push and pull travel motivations of domestic tourists to Kerala’. LIMBS, vol. 3, no. 2, pp.112-118. Web.
Kassean, H & Gassita, R, 2013. ‘Exploring tourists push and pull motivations to visit Mauritius as a tourist destination’. African Journal of Hospitality, Tourism and Leisure, vol. 2, no. 3, pp.1-13, Web.
Kitterlin, M & Yoo, M, 2014. ‘Festival motivation and loyalty factors,’ Tourism and Management Studies, vol.10, no.1, pp.119-126, Web.
Kloet, J, 2012. Popular music and youth in urban China: The Dakou generation. Web.
Kouthouris, C, 2009. ‘An examination of the relationships between motivation, involvement and intention to continuing participation among recreational skiers,’ International Journal of Sport Management, Recreation & Tourism, vol.4, pp.1-19. Web.
Kozak, M & Rimmington, M, 2000. ‘Tourist satisfaction with Mallorca, Spain as an off- season holiday destination’. Journal of Travel Research, vol. 38, pp. 260-269. Web.
Kruger, M, Saayman, M & Ellis, S M, 2010. ‘Does loyalty pay? First-time versus repeat visitors at a national arts festival,’ Southern African Business Review, vol. 14, no. 1, pp.79-104. Web.
Lee, J C, 2002. Factors that motivate college students to choose Wisconsin tourist destinations & attractions. Web.
McGhee,N G, Murphy, L L & Uysal, M, 1996. ‘The Australian international pleasure travel market: Motivations from a gendered perspective,’ The Journal of Tourism Studies, vol. 7, no. 1, pp.45-57. Web.
Mohammad , B A, & Som, A P M, 2010, ‘An analysis of push and pull travel motivations of foreign tourists to Jordan,’ International Journal of Business and Management, vol. 5, no. 12, pp.1-15. Web.
Moisa, C O, 2010. ‘The distinctiveness of the youth travel product’. Annales Universitatis Apulensis Series Oeconomica, vol.12, no. 2. Web.
More than bums on seat: Australian participation in the arts. 2010. Web.
Mosley, M C, Lehto, X & Day, J, n.d. The influence of the Jazz festival experience on tourist behaviour. Web.
North, C & Hargreaves , D J, 1999. ’Music and adolescent identity’. Music Education Research, vol. 1, no.1, pp. 75-92. Web.
Oliver, R L, 2010. Satisfaction, M.E.Sharp, New York.
Outdoor Music: Split Works, 2013. Web.
Packer, J & Ballantyne, J, 2011. ‘The impact of music festival attendance on young people’s psychological and social well being,’ Psychology of Music, vol. 39, no. 2, pp.164-181. Web.
Pascoe, R, Leong, S, MacCallum, J, Mackinlay, E, Marsh, K, Smith, B, Church, T & Winterton, A. 2005. National review of school music education. Web.
Phillimore, J, & Goodson, L, 2004. Progress in qualitative research in tourism:Epistemology, ontology and methodology in Qualitative Research in Tourism: Ontologies, Routledge, New York.
Pitts, S, 2005. ‘What makes an audience? Investigating the roles and experiences of listeners at a chamber music festival’. Music and Letters, vol. 86, no.2, pp. 257-269. Web.
Popescu, R & Corbos, R, 2012. ‘The role festivals and cultural events in the strategic ok development of cities. Recommendations for Urban Areas in Russia’. Informatica Economica, vol. 16, no. 4, pp.19-28. Web.
Research Methodology: An Introduction. n. d. Web.
Richards, G & Wilson, J, 2003. ’New horizons in independent youth and student travel’ ISTC. Web.
Ross, J, 1999. Ways of approaching research: Quantitative designs. Web.
Shwartz, R, 2015. Modern sky grows strawberry festival around China despite Beijing cancellation. Web.
Small, K E, 2007. Understanding the social impacts of festivals on communities. Web.
Scott-Halsell, S A & Saiprasert, W, 2011. ‘Spring break: Pulling in the student market,’ Journal of Tourism Insights, vol. 2, no.2, Article 3, pp.1-15. Web.
Smith, C E, 2010. Students beliefs about the benefits of travel and leisure: A qualitative analysis. Web.
Snell, K, 2005, ‘Music education trough popular music festivals’. ACT Journal, vol. 4, no. 2, pp. 1-35. Web.
Strawberry festival brings local, foreign talents to Beijing, 2014. Web.
Stettler, S L, 2011. ‘Sustainable event management of music festivals: An event organizer perspective,’ Dissertations and Theses, Web.
Strengths and Weaknesses of Quantitative Research, n.d., Web.
Sunderman, G, Christopher, A T, Kim, J, & Orfield, G, 2004, ‘Listening to teachers: Realities and No Child Left Behind’. Harvard Civil Rights Project. Web.
Thaothampitak, W & Weerakit, N, 2008, Tourist motivation and satisfaction: the case study of Trang Province, Thailand. Web.
Williams, S. 2004, The tourism: The experience of tourism, Taylor and Francis. Routledge, London.
Williamson, L. 2014. What’s driving Beijing’s indie boom?. Web.
Xu, Y, Yoder, D G, & Matarrita-Cascante, D, n.d., University students’ travel motivations for spring break vacations. Web.
Yolal, M, Woo, E & Centinel, F, 2012. ‘Comparative research of motivations across different festival products’. IJEFM, vol. 3, no.1, pp. 67-80. Web.
Yu, A H C & Yen, Y, 2012. ‘Segmenting art festival visitors by motivations,’ Annals of the Alexandru Ioan Cuza University – Economics, vol. 59, no.1, pp. 213–226. Web.