Data Warehouses
The term data warehouse essentially refers to a database which is used for the purposes of reporting and analysis, which is achieved through the collection and consolidation of data from the production systems of an organization. The data thus gathered and analyzed is distributed to subsets of the data warehouse known as data marts, from where it is accessible to the end user. This model is analogous to a wholesale, retail system, in which the goods are first collected in wholesale warehouses before being distributed to retail stores. The purpose of a data warehouse is to address issues of data synchronization and to harmonize inconsistencies in data that are a consequence of collecting data from multiple sources. As will be explained in more detail below, a data mart is a building block of a data warehouse. Data marts can be set up to hold different categories of data.
An organization should consider implementing a data warehouse when it has grown to such a size that it has to collect consistent data from various sources (including sources external to the organization) for the purposes of analysis and trend identification. One of the main problems an organization may face in implementing a data warehouse is that it is an incremental process, in which the number of subject areas increases with time, as well as the amount of data within each subject area.
To complicate the implementation process further, the data from different sources may be diverse in nature, such as numeric information, alphabetical information, and chronologically arranged data. The data may be discrete or continuous, and it may be recorded in a number of different formats. In order to address all of the aforementioned concerns, successful implementation of a data warehouse is likely to be realized over a considerable period of time, and it is a continuous process that can never be said to be complete.
The fundamental characteristics of a data warehouse are that it should be subject oriented, integrated, time variant and non-volatile. A subject oriented data warehouse is one in which data is classified together according to its relevance to a particular subject, for example, human resources data can be classified together, marketing data can be put in another category, and so on. An integrated data warehouse contains data from as many of the organization’s departments and systems as possible, and this data is made consistent so that data can be compared regardless of its system or department of origin. A time variant data warehouse means that the data contained within it has to be associated with defined periods of time. For this reason, data within the warehouse is usually time stamped. Finally, a non volatile data warehouse is one in which the data is stored permanently, and cannot be deleted as it is in a read-only format.
When setting up a data warehouse, the organization has to consider whether it is worthwhile to use a bottom up or top down approach. A bottom up approach is one in which individual data marts are built up over time and eventually integrated into a larger data warehouse. A bottom down approach is one in which the data warehouse is set up first, and then data is inserted into it later. The problem with a bottom up approach is that it takes a long period of time to set up and integrate the data marts into a consistent data warehouse. On the other hand, building a rigid data architecture in advance means that it will be difficult in future to create new data marts without affecting the structure of the entire data warehouse.
Another problem with data warehouses, which is discussed elsewhere within this text, is that they may not provide the most current, up to date information. This is because data is entered into data warehouses at periodic intervals, thus any user who accesses the data warehouse just before the next update is likely to receive information that is less than current. Fortunately, this problem has been solved to some extent by the advent of real time data warehousing.
A further problem associated with data warehouses is the cost aspect. Data warehouses are expensive to set up, and they require constant replenishment with data. The costs are mainly caused by the hardware requirements, such as buying and installing servers, and the human resource requirements. If an organization does not have a full time member of staff to manage the data warehouse, then it will have to hire an expert from outside the organization to do so, which is likely to increase costs even further. Fortunately, the cost of a data warehouse tends to be justified in the long term, as it saves valuable time in data processing, and aspects such as data mining may even create valuable opportunities for an organization.
The steps to be followed in designing a successful data warehouse are to first identify the different categories into which data is to be sorted, and then to set up a staging area, which receives data from the operational systems and categorizes it before sending it to the respective data marts. It is necessary to construct individual, independent data marts for each category. This is an incremental strategy known as a “bottom up” approach. The different data marts (such as a sales data mart and a production data mart) can later be integrated to form the data warehouse, in which integrated information from the data warehouse (the collective sum of the data marts) can be used for analysis. More data marts can be added over time, and integrated to the rest of the data warehouse. Once all these components of a data warehouse have been set up, the end users of the data warehouse can be granted access to it.
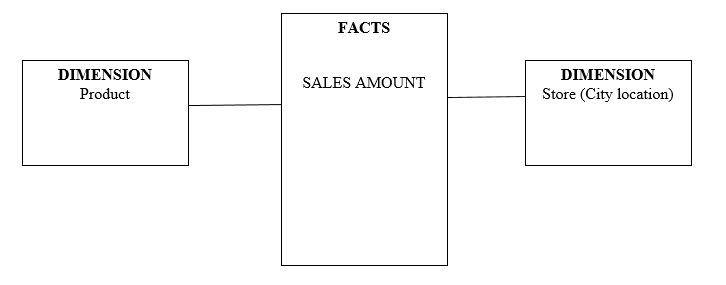
The concepts behind dimensional modeling are that data should be conceptualized, arranged and viewed as a set of measures that can be explained in terms of the characteristics of the organization. The two basic concepts in dimensional modeling are facts and dimensions. A fact is a collection of related data items, which are known as measures. Thus, the number of units sold is a fact, while each individual unit is a measure. A dimension is a parameter in which facts are analyzed, such as the period of time (a day, week or month) within which a particular fact (total units sold) is established, the type of product sold, the store from which the product units were sold, the customer the product was sold to, and so on (Inmon, 1992).
Dimensional modeling can be implemented through fact and dimension tables, and a star schema. A fact table is the arrangement of facts (such as units sold) into a particular section of a data warehouse. A dimension table is the arrangement of dimensions into a separate section of a data warehouse. As there are a number of different dimensions which relate to any fact, a fact table and the dimension tables which relate to it are integrated into a star schema, where the facts in the fact table (units sold) are connected to the dimensions in the dimension tables (time period, type of product, store name, and customer). It is known as a star schema because the fact table is represented at the center, while the relevant dimension tables connected to it are arranged around it. Star schemas form subsets of data marts, which in turn are subsets of data warehouses.
Real Time Data Warehousing (RDW) is a process in which the data in a data warehouse is updated continuously in real time. For example, new sales are incorporated into the data warehouse at the time the sale is made. This makes it possible to analyze the performance of an organization in real time from moment to moment, which gives data analysts and users the most recent data possible. Real Time Data Warehousing is different from conventional data warehousing approaches in that the conventional approaches add data periodically, such as at the end of every day, every week, or every month, by the use of extraction, transformation and load (ETL) tools. Thus, if data is added on a weekly basis, analysts may find themselves in the position of having to make decisions based on nearly week old data, which may bear little if any relation to the current state of the organization (Kimball & Ross, 2000).
Several criteria for selecting a data warehouse vendor are the experience of the vendor, the quality of its extraction, transformation and load tools (ETL), the speed and efficiency of the vendor’s data warehousing process, the reliability of the data warehouse across operating systems, and scalability. Experience is important because the organization needs a vendor who has handled data warehouses in the past and who is therefore conversant with any problems that may arise, so as to rectify them in the shortest time possible.
The quality of a vendor’s extraction, transformation and load (ETL) tools is also important because, as mentioned earlier, data from operational systems is presented in a variety of different formats. The vendor’s ETL tools must thus be capable of accessing these different forms of data, transforming them into consistent, compatible data and loading them into the data warehouse, from where they can be accessed without the need for further transformation or interpretation. The speed and efficiency of the vendor’s data warehousing process matters because of the importance of time to any organization. This is particularly true of organizations which require Real Time Data Warehousing.
If the updating of the data warehouse is not continuous, then the organization is likely to suffer from the consequences of using outdated information. The data warehouse vendor must also be familiar with different operating systems, and its data warehouse must be compatible with them, as the organization may require its data to be accessible from all systems. Finally, the data warehouse vendor must demonstrate that its data warehouse is scalable, so that as the organization grows in size and complexity, its access to valuable data will not be slowed down by the sheer volume of data that it generates and processes. These are the main factors to be taken into consideration when selecting a data warehouse vendor.
At this point it is worth mentioning Online Transaction Processing (OLTP), and explaining how it differs from data warehousing. Online Transaction Processing is a system in which online users have direct access to transactions and transaction information through the use of client/server applications. Examples of OLTP users are airline reservation clerks and bank tellers, although it is now possible for individual customers to purchase airline tickets and to bank online. Indeed, the scope of OLTP has expanded considerably with the growth of online shopping and online payment services such as PayPal.
Data warehousing and OLTP are compatible in the sense that OLTP providers require data warehouses to keep track of their transactions. However, unlike a conventional warehouse, OLTP providers cannot update their data at intervals, as transactions are taking place all the time. Thus OLTP providers are more likely to use Real Time Data Warehousing instead of conventional data warehousing. In addition, the architecture of an OLTP system is significantly different from that of a data warehouse, as it only contains transaction components, unlike a data warehouse, which has to incorporate diverse forms of data, some of which, taken at face value, may not appear to be mutually relevant.
Finally, with the growth of cloud computing, it is possible for OLTP systems to be hosted offsite, in the cloud. Indeed, cloud computing means that computing services can be regarded as a utility, just like water and electricity (Talia & Trunfio, 2010, p. 132). Organizations with data warehouses are more likely to keep their data onsite, in their own servers, but it is increasingly possible for them to set up their data warehouses offsite, if they wish to do so. With the foregoing in mind, it will suffice to say that Online Transaction Processing is not a completely separate, exclusive application from data warehousing, but instead it should be considered as one of the many applications that a data warehouse can be used for.
OLAP and Data Mining
Online Analytical Processing (OLAP) is similar to OLTP, in that users gave online access to analytical data. OLAP is used to answer queries that have multidimensional aspects. However, OLAP focuses on the analytical and financial aspects of organizational data, unlike OLTP, which deals specifically with transactions. OLAP has been separated from OLTP for the purposes of improved flexibility and performance. OLAP is built up around star schemas in the same way that data marts and ultimately data warehouses are built.. The relationship between OLAP and data warehousing is similar to that between OLTP and data warehousing.
Although the data in OLAP is available online and in some cases may even be stored in the “cloud”, OLAP data requires a data warehouse hosted on a physical server. OLAP also requires real time data warehousing to facilitate the work of analysts and accountants. A program such as QuickBooks can be integrated with an OLAP program, backed up by a data warehouse, to process financial information that the organization will require to plan for its future operations.
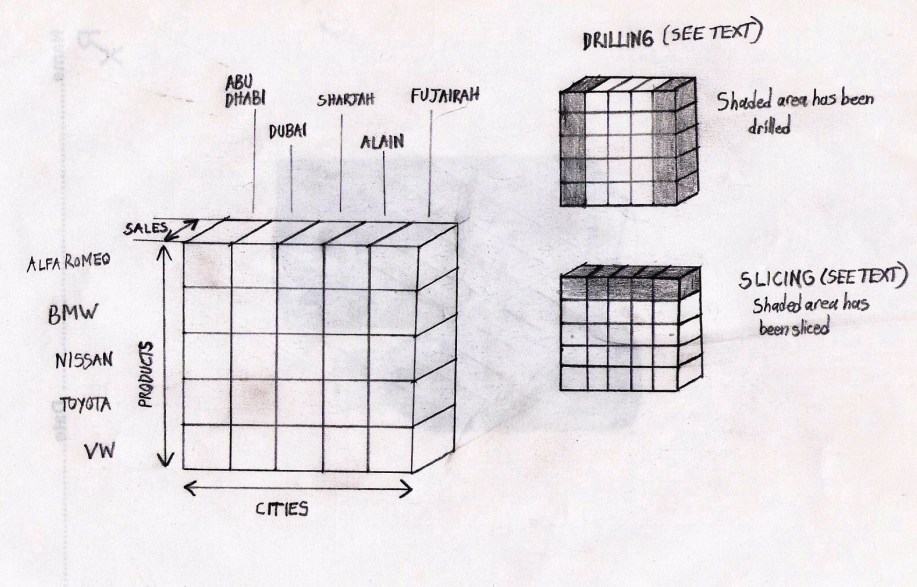
Multidimensional Data Cubes are the essence of Online Analytical Processing. They are also referred to as OLAP cubes. These cubes are set up in the same way as the components of data warehouses. Thus, they consist of numerical measures (such as dollars) which cumulatively amount to a fact (such as dollars earned per unit). These are contained in the fact table, which is connected through a star schema to dimension tables, which contain the dimensions relating to the facts, such as the product, time period, and city. Multidimensional Data Cubes can be represented as a multi- dimensional extension of a spreadsheet (which is two dimensional). Although cubes contain multiple dimensions, they are often diagrammatically represented as having three dimensions (just as a cube in the real world has three dimensions).
The terms drill down, roll up, slice and dice (or slice and cube), and rotation are used in connection with OLAP. Drill down refers to the process in which users of OLAP can access the data in detailed form, allowing them to examine different dimensions relating to a particular fact. Roll up, on the other hand, refers to the consolidation of all the measures/facts in the OLAP that can be categorized and computed in one or more dimensions.
The different points of view may either be different dimensions or different facts. Rotation means the process in which a financial analyst may manipulate the OLAP data cube in such a way as to highlight the information that is most relevant at the time. For instance, the analyst may begin by displaying cities and products on the two axes of the page, and then rotate the cube such that information on products could form one axis and information on time periods (a different dimension) could form the other axis (Mailvaganam, 2007).
The term data mining refers to the use of applications to find information by searching semi-automatically for previously unknown patterns and relationships in multidimensional databases. Thus data mining is a process which enables analysts to identify valuable patterns which are not immediately obvious, from a large collection of data, such as is found in a data warehouse. Data mining is merely one step in the process of Knowledge Discovery in Databases (KDD).
The complete KDD process involves selection, preprocessing, transformation and data mining. In selection, the amount of data that is required to be mined is selected. It may the contents of a data mart, a database, or even an entire data warehouse. In preprocessing, a target data set is determined. It is wasteful to data mine all the data in a data warehouse, especially if the data sought to be mined has already been categorized, either as a dimension in a data cube or as a data mart. During the transformation process, data is cleaned to make it consistent and to remove irrelevant data (noise) and to fill any gaps in the data.
Data mining differs from other approaches such as OLAP in that Online Analytical Processing (OLAP) software aims at identifying trends in the performance of an organization that will be useful to financial analysts, and executives in planning the future course of the organization. OLAP achieves this by granting users access to multidimensional views of enterprise data. Data mining, on the other hand, is not restricted to financial and analytical data, such as OLAP. Data mining can be carried out on any form of data, regardless of whether it is the data of an organization, whether it is accessible online or not, or whether the data has been classified intro relevant subsets or not (however, it is less time consuming if data mining is done on data which has been cleaned, as mentioned above).
The different data mining pattern types are associations, sequences, classification, clustering, and forecasting (or prediction). Associations are a type of data mining task in which the algorithm searches for relationships between variables. For example, if a supermarket has acquired data on the purchasing habits of its customers, it can use association to find out which products are most often bought in conjunction with each other and alter its marketing to capitalize on these relationships.
Sequences are data mining tasks in which the algorithm seeks frequent sequences within a database. This will usually apply to two variables, such as a product and time. For instance, a supermarket may want to find out the times during the day when a particular product has the highest sales. The supermarket may capitalize on this data by maximizing the presence of these products at the relevant times. Sequencing is also used to determine whether the sequence of variations in human DNA makes one more susceptible to certain diseases, such as cancer.
Clustering is the data on a personal file in the human relations department, but which may not have been noticed prior to data mining.
Forecasting (prediction) is the process of applying a predictive model to a dataset. Prediction is any process for assigning values to previously unassigned datasets. By so doing, data mining identify variables in such a way that the appearance of one variable can be linked to the appearance of another. For example, if a supermarket has noticed an increase in the incidence of theft, it can apply data mining to its database. If the results show that the incidence of theft coincides with the presence of certain employees, the supermarket can predict the next likely incidence of theft and take remedial measures.
Web mining and text mining are forms of data mining in which patterns and knowledge are discovered on the internet. Web content mining is also referred to as web text mining. This is because the bulk of information on the internet exists in the form of text. Therefore, web mining is the process of applying data mining to discover useful information from web pages, including text, images, audio or video data, while web text mining is the identification of interesting and significant information specifically from text on the web (Castellano et al., 2007, p. 78).
It is possible to use data mining to establish the extent to which members of a team actually engage in teamwork. This can be done by setting up a web page, called a Wiki, which is a collaborative page on which all members of a study team can make contributions. All of the events that take place on the Wiki are recorded on a database. It is the data thus acquired which can be mined to determine whether there is meaningful group interaction between members of the team or not (Kay, Maisonneuve, Yacef, & Zaïane, 2007, p.1).
Data warehouse for second hand cars in the UAE
One example of drilling is examining the left hand side column, which corresponds to the sales in Abu Dhabi of the five different car products. Another example of drilling is the extreme right hand column, which represents the sales of five different products in Fujairah.
Slicing occurs when we examine for instance, the left hand side column, which corresponds to the sales in Abu Dhabi of the five different car products. Because the sales dimension is only one cube thick, in this instance slicing and drilling have the same outcome. However, the top row of the cube can also be sliced, to come up with the sales of Alfa Romeo products in the five cities. A time variant data warehouse means that the data contained within it has to be associated with defined periods of time. For this reason, data within the warehouse is usually time stamped. Finally, a non volatile data warehouse is one in which the data is stored permanently, and cannot be deleted as it is in a read-only format.
Data mining techniques could be used to investigate variables in the dataset. For example, data mining could be used to show a relationship between the number of stores in a city and the volume of sales in that city. Alternatively, data mining could be used to show which cars are most popular in different cities. Thus, in the first instance, the number of stores in a city would be a variable and the sales volumes would be another variable. In the second instance, the city names would be one variable and the sales volumes would be another variable. These variables would be used in the data mining process to identify these trends.
References
Castellano, M., Mastronardi, G., Aprile, A., & Tarricone, G. (2007). A Web text mining flexible architecture. World Academy of Science, Engineering and Technology, 32. Web.
Inmon, B. (1992). Building the Data Warehouse. New York, NY: Wiley. Web.
Kay, J., Maisonneuve, N., Yacef, K., & Zaïane, O. (2007). Mining patterns of events in students’ teamwork data. Sydney: University of Sydney, School of Information Technologies. Web.
Kimball, R., & Ross, M. (2000). The Data Warehouse Toolkit (2nd ed). New York: John Wiley and Sons, Inc. Web.
Mailvaganam, H. (2007). Introduction to OLAP – slice, dice and drill. DWreview. Web.
Talia, D., & Trunfio, P. (2010). How distributed data mining tasks can thrive as knowledge services. Communications of the ACM, 53(7), 132-137. Web.
Appendix